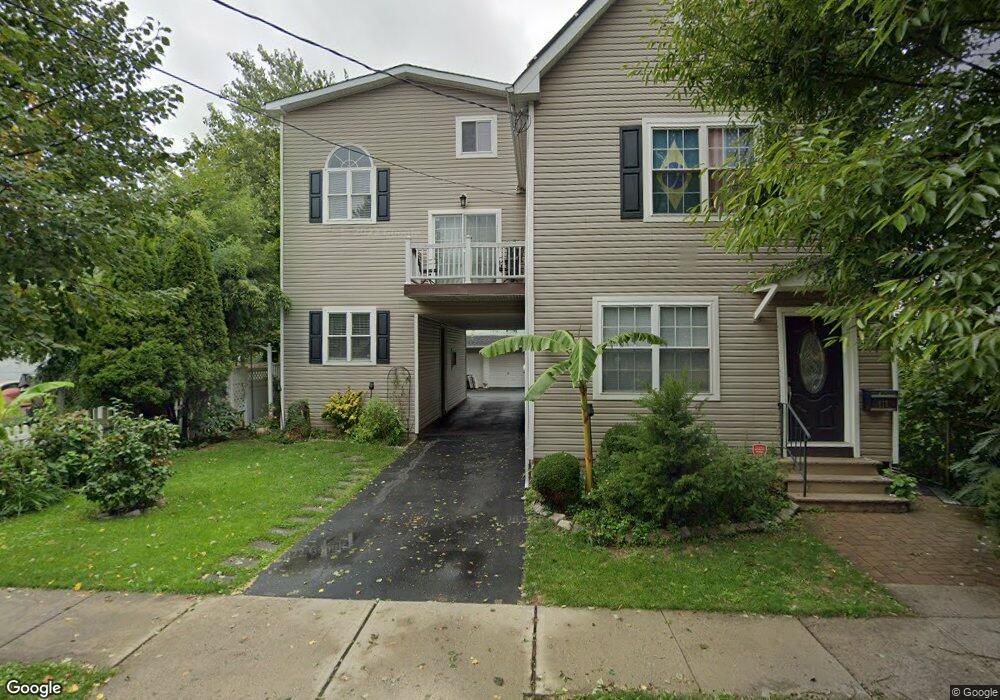
111 E 20th St Linden, NJ 07036
Estimated Value: $588,616 - $769,000
--
Bed
--
Bath
2,514
Sq Ft
$279/Sq Ft
Est. Value
About This Home
This home is located at 111 E 20th St, Linden, NJ 07036 and is currently estimated at $700,154, approximately $278 per square foot. 111 E 20th St is a home located in Union County with nearby schools including School No. 2, Myles J. McManus Middle School, and Linden High School.
Ownership History
Date
Name
Owned For
Owner Type
Purchase Details
Closed on
Jan 31, 2025
Sold by
Rempel Paul and Rempel Hulda
Bought by
Cobra Trust and Rempel
Current Estimated Value
Purchase Details
Closed on
Mar 7, 2016
Sold by
Rempel Paul
Bought by
Rempel Paul and Rempel Hulda
Home Financials for this Owner
Home Financials are based on the most recent Mortgage that was taken out on this home.
Original Mortgage
$199,700
Interest Rate
3.01%
Mortgage Type
New Conventional
Purchase Details
Closed on
Mar 21, 2006
Sold by
Rempel Oswino
Bought by
Rempel Paul
Purchase Details
Closed on
Jan 27, 2000
Sold by
Roper Emanuel and Roper Ruth
Bought by
Rempel Oswino and Bilozir Erika
Home Financials for this Owner
Home Financials are based on the most recent Mortgage that was taken out on this home.
Original Mortgage
$90,210
Interest Rate
7.91%
Create a Home Valuation Report for This Property
The Home Valuation Report is an in-depth analysis detailing your home's value as well as a comparison with similar homes in the area
Home Values in the Area
Average Home Value in this Area
Purchase History
| Date | Buyer | Sale Price | Title Company |
|---|---|---|---|
| Cobra Trust | -- | None Listed On Document | |
| Cobra Trust | -- | None Listed On Document | |
| Rempel Paul | -- | -- | |
| Rempel Paul | -- | -- | |
| Rempel Oswino | $93,000 | -- |
Source: Public Records
Mortgage History
| Date | Status | Borrower | Loan Amount |
|---|---|---|---|
| Previous Owner | Rempel Paul | $199,700 | |
| Previous Owner | Rempel Oswino | $90,210 |
Source: Public Records
Tax History Compared to Growth
Tax History
| Year | Tax Paid | Tax Assessment Tax Assessment Total Assessment is a certain percentage of the fair market value that is determined by local assessors to be the total taxable value of land and additions on the property. | Land | Improvement |
|---|---|---|---|---|
| 2025 | $13,312 | $189,300 | $46,000 | $143,300 |
| 2024 | $13,020 | $189,300 | $46,000 | $143,300 |
| 2023 | $13,020 | $189,300 | $46,000 | $143,300 |
| 2022 | $13,088 | $189,300 | $46,000 | $143,300 |
| 2021 | $13,154 | $189,300 | $46,000 | $143,300 |
| 2020 | $13,084 | $189,300 | $46,000 | $143,300 |
| 2019 | $13,041 | $189,300 | $46,000 | $143,300 |
| 2018 | $13,037 | $189,300 | $46,000 | $143,300 |
| 2017 | $12,755 | $189,300 | $46,000 | $143,300 |
| 2016 | $12,354 | $189,300 | $46,000 | $143,300 |
| 2015 | $11,882 | $189,300 | $46,000 | $143,300 |
| 2014 | $11,651 | $189,300 | $46,000 | $143,300 |
Source: Public Records
Map
Nearby Homes
- 1713 S Wood Ave Unit 2
- 108 W 18th St
- 1519 Winans Ave
- 111 E 13th St
- 116 W 17th St
- 321 W 15th St Unit 1
- 111 E 10th St
- 2617 Grasselli Ave
- 210 Buchanan St
- 118 Union Ave Unit 2
- 221 Madison St
- 2604 Parkway Ave Unit 2
- 3202 Tremley Point Rd
- 317 Mitchell Ave
- 214 Irene St
- 14 Arlington Place
- 221 Jefferson Ave
- 212 W Morris Ave
- 226 Pennsylvania Railroad Ave
- 120 S Stiles St
- 115 E 20th St
- 1917 Clinton St Unit 1919
- 1913 Clinton St Unit 1915
- 121 E 20th St
- 110 E 19th St
- 1909 Clinton St
- 118 E 19th St
- 1901 Clinton St
- 1817 Clinton St
- 1912 Clinton St
- 1918 Clinton St
- 1813 Clinton St
- 1908 Clinton St
- 1807 Clinton St
- 37 E 20th St
- 40 E 19th St
- 1814 Clinton St
- 36 E 19th St Unit 1
- 36 E 19th St
- 1812 Clinton St