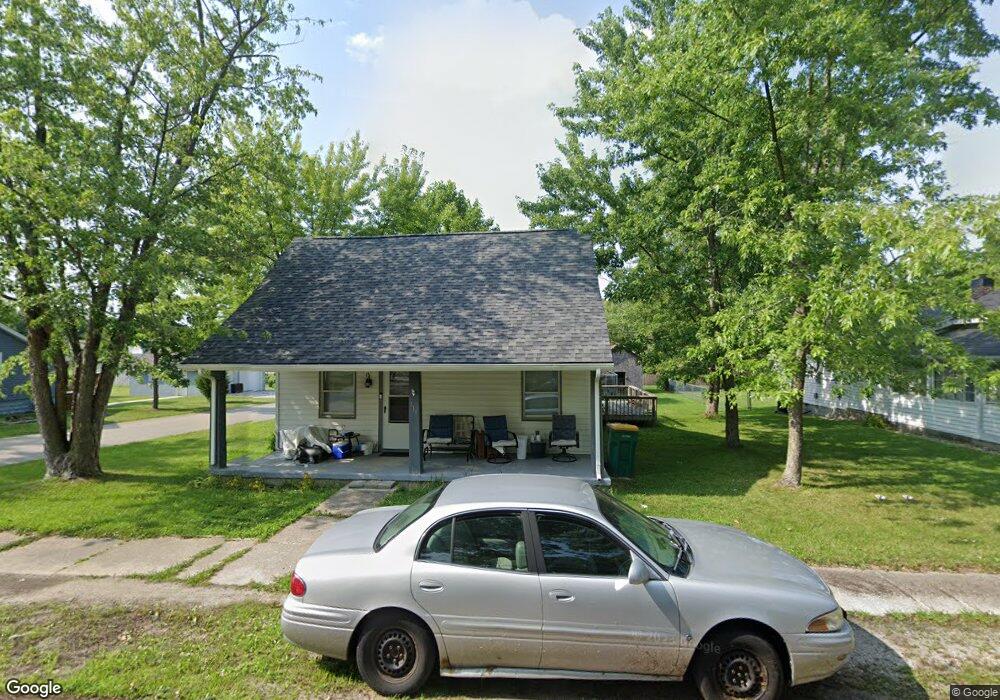
111 E Anson St Upland, IN 46989
Estimated Value: $87,000 - $147,000
About This Home
This home is located at 111 E Anson St, Upland, IN 46989 and is currently estimated at $123,331, approximately $112 per square foot. 111 E Anson St is a home.
Ownership History
We collect this data history from publicly available records. To have your information removed, we recommend requesting removal directly through your county’s website.
Purchase Details
Home Financials for this Owner
Home Financials are based on the most recent Mortgage that was taken out on this home.Purchase Details
Home Values in the Area
Average Home Value in this Area
Purchase History
We collect this data history from publicly available records. To have your information removed, we recommend requesting removal directly through your county’s website.
| Date | Buyer | Sale Price | Title Company |
|---|---|---|---|
| $65,400 | None Available | ||
| -- | None Available |
Mortgage History
We collect this data history from publicly available records. To have your information removed, we recommend requesting removal directly through your county’s website.
| Date | Status | Borrower | Loan Amount |
|---|---|---|---|
| Open | $67,575 |
Tax History
We collect this data history from publicly available records. To have your information removed, we recommend requesting removal directly through your county’s website.
| Year | Tax Paid | Tax Assessment Tax Assessment Total Assessment is a certain percentage of the fair market value that is determined by local assessors to be the total taxable value of land and additions on the property. | Land | Improvement |
|---|---|---|---|---|
| 2025 | $465 | $91,000 | $15,700 | $75,300 |
| 2024 | $329 | $79,300 | $15,700 | $63,600 |
| 2023 | $357 | $83,100 | $15,700 | $67,400 |
| 2022 | $327 | $77,200 | $11,800 | $65,400 |
| 2021 | $282 | $69,600 | $11,800 | $57,800 |
| 2020 | $1,043 | $66,100 | $11,200 | $54,900 |
| 2019 | $908 | $63,500 | $11,200 | $52,300 |
| 2018 | $791 | $59,000 | $10,200 | $48,800 |
| 2017 | $0 | $57,700 | $10,200 | $47,500 |
| 2016 | $12 | $57,800 | $10,200 | $47,600 |
| 2014 | $12 | $63,200 | $10,200 | $53,000 |
| 2013 | $12 | $70,000 | $10,200 | $59,800 |
Map
- 154 N Half St
- 171 S Main St
- 134 W Jefferson St
- Lot 9 W South St
- Lot 7 W South St
- Lot 8 W South St
- 656 S Main St
- 855 S 8th St
- 1002 S 8th St
- 5950 E 500 S
- 1334 S 8th St
- 526 W Reade Ave
- 3641 S 1000 E
- 499 W Overlook Dr
- 7960 S 950 E
- 0 E 200 S Unit 202601439
- 617 S 350 W
- 2866 W State Road 26
- 1888 S 700 E
- 963 Eva Ln
- 121 E Anson St
- 282 Grant St
- 182 N Grant St
- 138 E Urban St
- 81 E Anson St
- 282 E Urban St
- 171 N East St
- 80 Urban St
- 62 E Anson St
- 259 East St
- 60 Urban St
- 170 East St
- 217 E Washington St
- 121 Urban St
- 63 E Washington St
- 169 E Washington St
- 81 E Washington St
- 181 Urban St
- 211 E Washington St
- 265 W Anson St
Ask me questions while you tour the home.