111 E Maple Dr Glenwood, IL 60425
Glenwood AreaEstimated Value: $209,000 - $225,000
About This Home
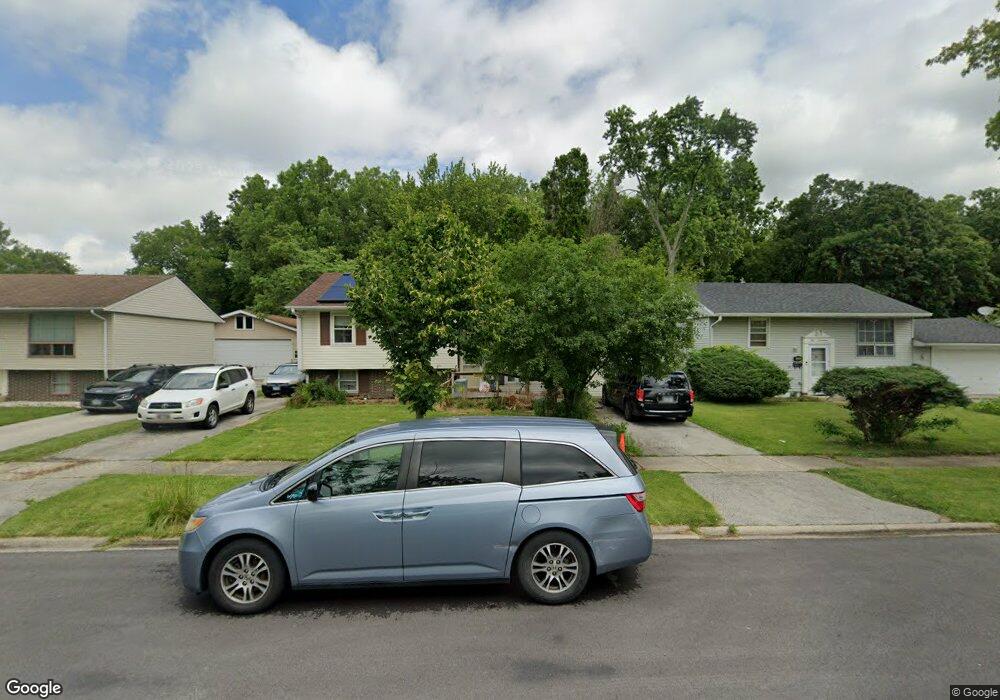
This home is located at 111 E Maple Dr, Glenwood, IL 60425 and is currently estimated at $218,259, approximately $143 per square foot. 111 E Maple Dr is a home located in Cook County with nearby schools including Brookwood Middle School, Hickory Bend Elementary School, and Brookwood Jr High School.
Ownership History
We collect this data history from publicly available records. To have your information removed, we recommend requesting removal directly through your county’s website.
Purchase Details
Purchase Details
Home Values in the Area
Average Home Value in this Area
Purchase History
We collect this data history from publicly available records. To have your information removed, we recommend requesting removal directly through your county’s website.
| Date | Buyer | Sale Price | Title Company |
|---|---|---|---|
| -- | None Available | ||
| $91,000 | Lawyers Title Insurance Corp |
Tax History
We collect this data history from publicly available records. To have your information removed, we recommend requesting removal directly through your county’s website.
| Year | Tax Paid | Tax Assessment Tax Assessment Total Assessment is a certain percentage of the fair market value that is determined by local assessors to be the total taxable value of land and additions on the property. | Land | Improvement |
|---|---|---|---|---|
| 2025 | $6,795 | $20,000 | $2,953 | $17,047 |
| 2024 | $6,795 | $20,000 | $2,953 | $17,047 |
| 2023 | $4,964 | $20,000 | $2,953 | $17,047 |
| 2022 | $4,964 | $12,679 | $2,531 | $10,148 |
| 2021 | $4,982 | $12,679 | $2,531 | $10,148 |
| 2020 | $5,101 | $12,679 | $2,531 | $10,148 |
| 2019 | $4,576 | $11,845 | $2,320 | $9,525 |
| 2018 | $4,348 | $11,845 | $2,320 | $9,525 |
| 2017 | $4,416 | $11,845 | $2,320 | $9,525 |
| 2016 | $5,043 | $12,030 | $2,109 | $9,921 |
| 2015 | $4,827 | $12,030 | $2,109 | $9,921 |
| 2014 | $4,771 | $12,030 | $2,109 | $9,921 |
| 2013 | $4,287 | $12,035 | $2,109 | $9,926 |
Map
- 127 N Cedar Ln
- 151 E Maple Dr
- 110 N Oak Ln
- 231 E Tulip Dr
- 51 N Pine Ln
- 105 E Center St
- 47 N Wabash Ave
- 23 N Wabash Ave
- 335 E Mulberry Dr
- 114 E Clark St
- 115 N State St
- 40 S Sycamore Ln
- 17 S Wabash Ave
- 7 N State St
- 126 S Campbell Ave
- 114 S Willow Ln
- 450 E Mulberry Ct
- 120 S Wabash Ave
- 108 Campbell Ave
- 308 S Hickory St
Ask me questions while you tour the home.