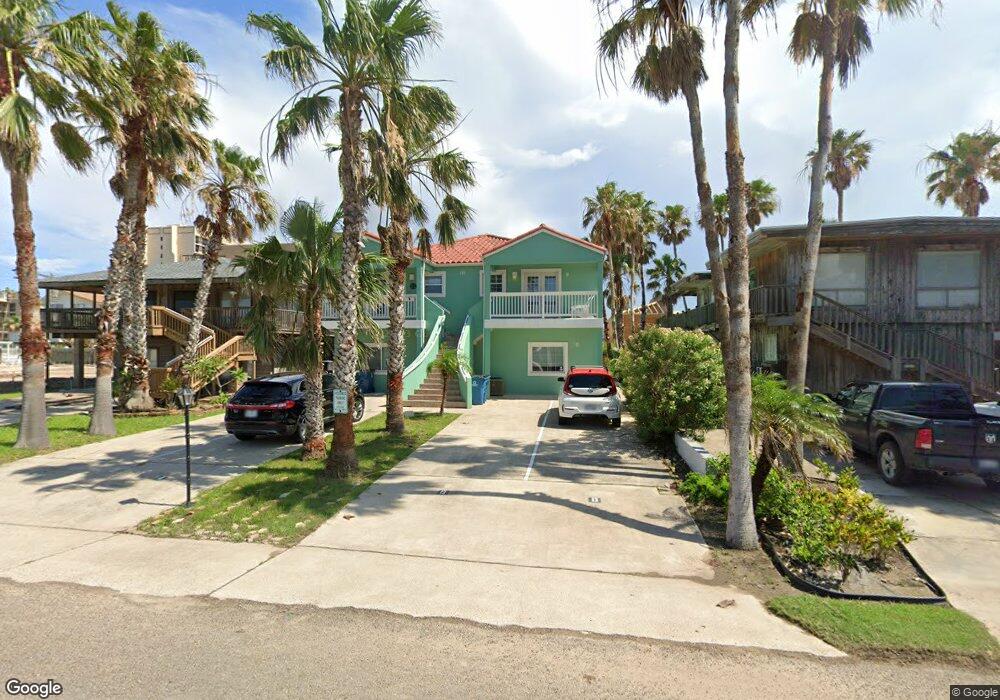
111 E Marlin St Unit A South Padre Island, TX 78597
Estimated Value: $287,216 - $537,000
2
Beds
2
Baths
880
Sq Ft
$404/Sq Ft
Est. Value
About This Home
This home is located at 111 E Marlin St Unit A, South Padre Island, TX 78597 and is currently estimated at $355,554, approximately $404 per square foot. 111 E Marlin St Unit A is a home located in Cameron County with nearby schools including Garriga Elementary School, Derry Elementary School, and Port Isabel Junior High School.
Ownership History
Date
Name
Owned For
Owner Type
Purchase Details
Closed on
Jan 14, 2021
Sold by
Steinmann Horst H M and Steinmann Bonnie M
Bought by
Ocilka John S and Ocilka Lisa M
Current Estimated Value
Home Financials for this Owner
Home Financials are based on the most recent Mortgage that was taken out on this home.
Original Mortgage
$157,500
Outstanding Balance
$140,569
Interest Rate
2.71%
Mortgage Type
New Conventional
Estimated Equity
$214,985
Purchase Details
Closed on
Apr 8, 2015
Sold by
Steinmann Horst and Steinmann Bonnie
Bought by
Steinmann Horst H M and Steinmann Bonnie M
Purchase Details
Closed on
Jun 28, 2005
Sold by
Ziolkowski Mary Pat
Bought by
Steinmann Horst and Steinmann Bonnie
Home Financials for this Owner
Home Financials are based on the most recent Mortgage that was taken out on this home.
Original Mortgage
$127,920
Interest Rate
5.67%
Mortgage Type
Fannie Mae Freddie Mac
Create a Home Valuation Report for This Property
The Home Valuation Report is an in-depth analysis detailing your home's value as well as a comparison with similar homes in the area
Home Values in the Area
Average Home Value in this Area
Purchase History
| Date | Buyer | Sale Price | Title Company |
|---|---|---|---|
| Ocilka John S | -- | Edwards Abstract | |
| Steinmann Horst H M | -- | None Available | |
| Steinmann Horst | -- | Southern Texas Title Co | |
| Ziolkowski Mary Pat | -- | Southern Texas Title Co |
Source: Public Records
Mortgage History
| Date | Status | Borrower | Loan Amount |
|---|---|---|---|
| Open | Ocilka John S | $157,500 | |
| Previous Owner | Steinmann Horst | $127,920 |
Source: Public Records
Tax History Compared to Growth
Tax History
| Year | Tax Paid | Tax Assessment Tax Assessment Total Assessment is a certain percentage of the fair market value that is determined by local assessors to be the total taxable value of land and additions on the property. | Land | Improvement |
|---|---|---|---|---|
| 2025 | $2,669 | $242,919 | -- | -- |
| 2024 | $2,669 | $220,835 | -- | -- |
| 2023 | $5,436 | $317,074 | $56,250 | $260,824 |
| 2022 | $3,458 | $182,508 | $43,750 | $138,758 |
| 2021 | $3,451 | $171,571 | $32,813 | $138,758 |
| 2020 | $3,474 | $171,571 | $32,813 | $138,758 |
| 2019 | $3,510 | $170,008 | $31,250 | $138,758 |
| 2018 | $3,508 | $170,008 | $31,250 | $138,758 |
| 2017 | $3,511 | $171,477 | $31,250 | $140,227 |
| 2016 | $3,541 | $172,946 | $31,250 | $141,696 |
| 2015 | $3,015 | $149,808 | $31,250 | $118,558 |
Source: Public Records
Map
Nearby Homes
- 115 E Marlin St Unit B
- 114 E Tarpon St Unit 201
- 104 E Tarpon St
- 104 E Tarpon St Unit 1-4
- 111 E Tarpon St
- 102 E Tarpon St
- 102 E Marlin St Unit 11
- 2401 Gulf Blvd Unit 214
- 107 E Ling St Unit 108
- 2100 Gulf Blvd Unit 1003
- 2100 Gulf Blvd Unit 404
- 2100 Gulf Blvd
- 2100 Gulf Blvd Unit 1005
- 113 E Pike St Unit 5
- 113 E Pike St Unit 11
- 109 E Pompano St
- 107 Pike St
- 108 E Sheepshead St
- 105 E Pike St
- 122 E Pike St Unit 22
- 111 E Marlin St
- 111 E Marlin St
- 111 E Marlin St
- 111 E Marlin St
- 111 E Marlin St Unit 10
- 111 E Marlin St Unit Tropical Breeze B
- 111 E Marlin St Unit D
- 111 E Marlin St Unit C
- 111 E Marlin St Unit B
- 109 E Marlin St
- 115 E Marlin St Unit C
- 115 E Marlin St Unit D
- 0 E Marlin St Unit 11
- 109 E-Atol St
- 110 E Tarpon St
- 112 E Tarpon St Unit 18
- 112 E Tarpon St
- 108B E Tarpon St
- 117 E Marlin St Unit B
- 117 E Marlin St Unit C