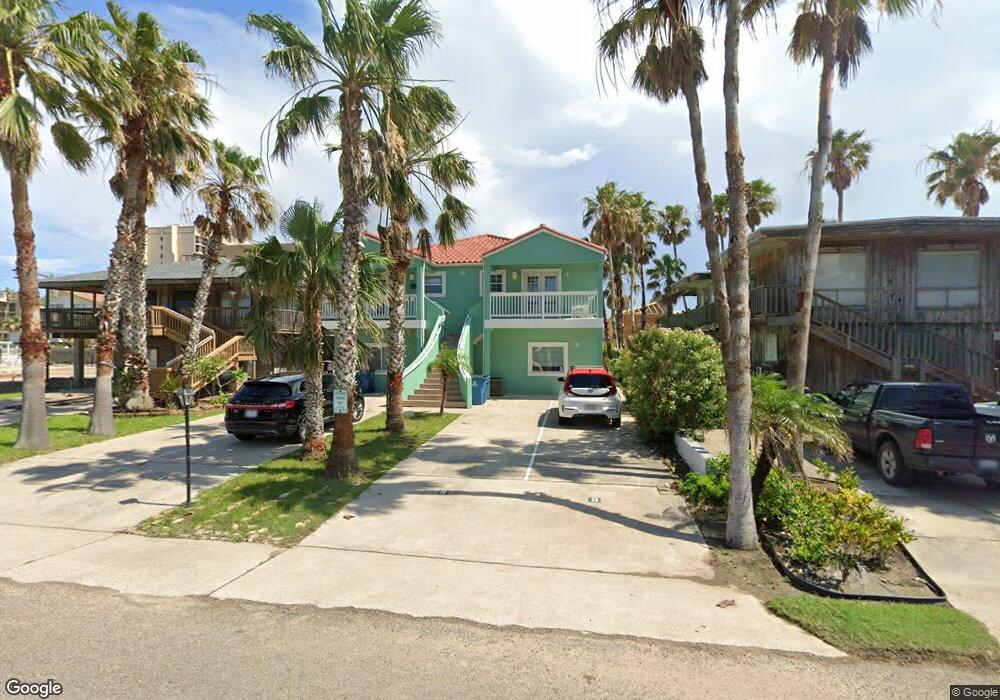
111 E Marlin St Unit B South Padre Island, TX 78597
Estimated Value: $297,094 - $537,000
2
Beds
2
Baths
880
Sq Ft
$415/Sq Ft
Est. Value
About This Home
This home is located at 111 E Marlin St Unit B, South Padre Island, TX 78597 and is currently estimated at $364,774, approximately $414 per square foot. 111 E Marlin St Unit B is a home located in Cameron County with nearby schools including Garriga Elementary School, Derry Elementary School, and Port Isabel Junior High School.
Ownership History
Date
Name
Owned For
Owner Type
Purchase Details
Closed on
Apr 12, 2021
Sold by
Robledo Mathew Anthony and Robledo Tina V
Bought by
Ultimate Investments Llc
Current Estimated Value
Purchase Details
Closed on
Feb 14, 2020
Sold by
Fischer Bernard and Fischer Virginia
Bought by
Robledo Matthew Anthony and Robledo Tina Vi
Home Financials for this Owner
Home Financials are based on the most recent Mortgage that was taken out on this home.
Original Mortgage
$111,375
Interest Rate
3.72%
Mortgage Type
New Conventional
Purchase Details
Closed on
Oct 27, 2006
Sold by
Sterling Trust Co
Bought by
Fischer Bernard and Fischer Virginia
Home Financials for this Owner
Home Financials are based on the most recent Mortgage that was taken out on this home.
Original Mortgage
$168,000
Interest Rate
6.37%
Mortgage Type
Purchase Money Mortgage
Create a Home Valuation Report for This Property
The Home Valuation Report is an in-depth analysis detailing your home's value as well as a comparison with similar homes in the area
Home Values in the Area
Average Home Value in this Area
Purchase History
| Date | Buyer | Sale Price | Title Company |
|---|---|---|---|
| Ultimate Investments Llc | -- | None Available | |
| Robledo Matthew Anthony | -- | Rio Grande Valley Abstract C | |
| Fischer Bernard | -- | Southern Texas Title Co |
Source: Public Records
Mortgage History
| Date | Status | Borrower | Loan Amount |
|---|---|---|---|
| Previous Owner | Robledo Matthew Anthony | $111,375 | |
| Previous Owner | Fischer Bernard | $168,000 |
Source: Public Records
Tax History Compared to Growth
Tax History
| Year | Tax Paid | Tax Assessment Tax Assessment Total Assessment is a certain percentage of the fair market value that is determined by local assessors to be the total taxable value of land and additions on the property. | Land | Improvement |
|---|---|---|---|---|
| 2025 | $5,320 | $305,554 | $56,250 | $249,304 |
| 2024 | $5,320 | $325,798 | $56,250 | $269,548 |
| 2023 | $5,586 | $325,798 | $56,250 | $269,548 |
| 2022 | $3,423 | $180,663 | $43,750 | $136,913 |
| 2021 | $3,413 | $169,726 | $32,813 | $136,913 |
| 2020 | $3,437 | $169,726 | $32,813 | $136,913 |
| 2019 | $3,472 | $168,163 | $31,250 | $136,913 |
| 2018 | $3,470 | $168,163 | $31,250 | $136,913 |
| 2017 | $3,473 | $169,613 | $31,250 | $138,363 |
| 2016 | $3,502 | $171,061 | $31,250 | $139,811 |
| 2015 | $2,983 | $148,231 | $31,250 | $116,981 |
Source: Public Records
Map
Nearby Homes
- 115 E Marlin St Unit B
- 114 E Tarpon St Unit 201
- 104 E Tarpon St
- 104 E Tarpon St Unit 1-4
- 111 E Tarpon St
- 102 E Tarpon St
- 102 E Marlin St Unit 11
- 2401 Gulf Blvd Unit 214
- 107 E Ling St Unit 108
- 2100 Gulf Blvd Unit 1003
- 2100 Gulf Blvd Unit 404
- 2100 Gulf Blvd
- 2100 Gulf Blvd Unit 1005
- 113 E Pike St Unit 5
- 113 E Pike St Unit 11
- 109 E Pompano St
- 107 Pike St
- 108 E Sheepshead St
- 105 E Pike St
- 122 E Pike St Unit 22
- 111 E Marlin St
- 111 E Marlin St
- 111 E Marlin St
- 111 E Marlin St
- 111 E Marlin St Unit 10
- 111 E Marlin St Unit Tropical Breeze B
- 111 E Marlin St Unit D
- 111 E Marlin St Unit C
- 111 E Marlin St Unit A
- 109 E Marlin St
- 115 E Marlin St Unit C
- 115 E Marlin St Unit D
- 0 E Marlin St Unit 11
- 109 E-Atol St
- 110 E Tarpon St
- 112 E Tarpon St Unit 18
- 112 E Tarpon St
- 108B E Tarpon St
- 117 E Marlin St Unit B
- 117 E Marlin St Unit C