Estimated Value: $174,000 - $209,000
2
Beds
2
Baths
1,325
Sq Ft
$143/Sq Ft
Est. Value
About This Home
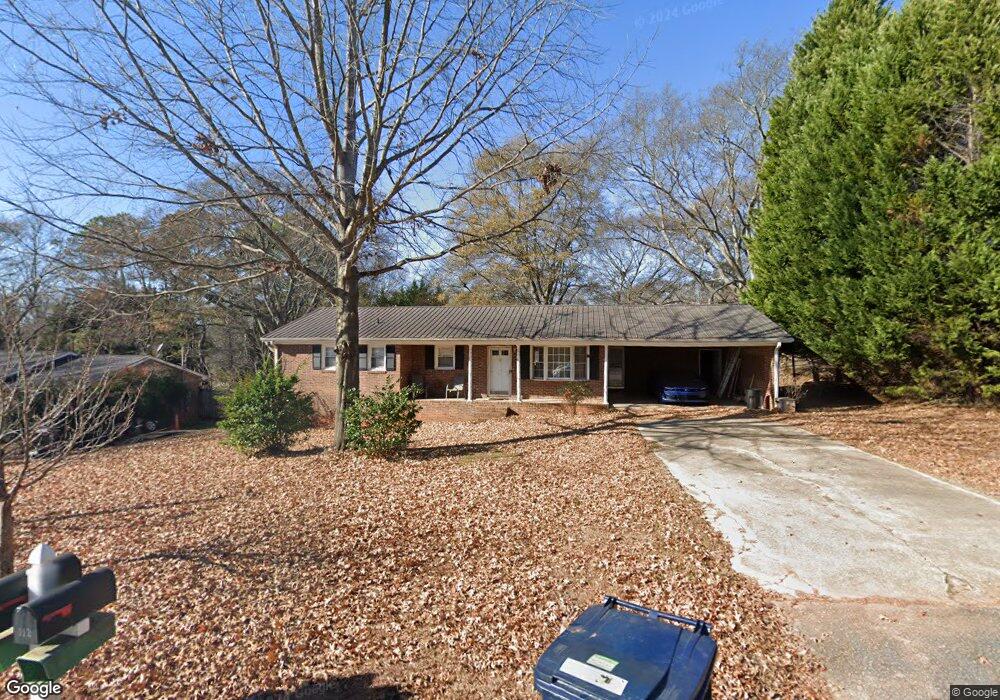
This home is located at 111 Elberta St, Inman, SC 29349 and is currently estimated at $188,943, approximately $142 per square foot. 111 Elberta St is a home located in Spartanburg County with nearby schools including Inman Elementary School, T.E. Mabry Middle School, and Chapman High School.
Ownership History
Date
Name
Owned For
Owner Type
Purchase Details
Closed on
May 9, 2022
Sold by
Rogers Brown Will
Bought by
Hopkins Alexander
Current Estimated Value
Home Financials for this Owner
Home Financials are based on the most recent Mortgage that was taken out on this home.
Original Mortgage
$139,417
Outstanding Balance
$132,443
Interest Rate
5.25%
Mortgage Type
FHA
Estimated Equity
$56,500
Purchase Details
Closed on
Jun 9, 2014
Sold by
Estate Of Brenda Kay Ivey Brown
Bought by
Brown Will Rogers
Purchase Details
Closed on
May 31, 2002
Sold by
Johnson Ralph E and Johnson Betty L
Bought by
Brown Will R and Brown Brenda I
Create a Home Valuation Report for This Property
The Home Valuation Report is an in-depth analysis detailing your home's value as well as a comparison with similar homes in the area
Home Values in the Area
Average Home Value in this Area
Purchase History
| Date | Buyer | Sale Price | Title Company |
|---|---|---|---|
| Hopkins Alexander | $161,200 | Odom Law Firm | |
| Brown Will Rogers | -- | -- | |
| Brown Will R | $92,000 | Hanover Title Agency |
Source: Public Records
Mortgage History
| Date | Status | Borrower | Loan Amount |
|---|---|---|---|
| Open | Hopkins Alexander | $139,417 |
Source: Public Records
Tax History
| Year | Tax Paid | Tax Assessment Tax Assessment Total Assessment is a certain percentage of the fair market value that is determined by local assessors to be the total taxable value of land and additions on the property. | Land | Improvement |
|---|---|---|---|---|
| 2022 | $755 | $4,876 | $1,188 | $3,688 |
| 2021 | $740 | $4,876 | $1,188 | $3,688 |
| 2020 | $720 | $4,876 | $1,188 | $3,688 |
| 2019 | $729 | $4,876 | $1,188 | $3,688 |
| 2018 | $720 | $4,876 | $1,188 | $3,688 |
| 2017 | $575 | $4,316 | $1,188 | $3,128 |
| 2016 | $558 | $4,316 | $1,188 | $3,128 |
| 2015 | $553 | $4,316 | $1,188 | $3,128 |
| 2014 | $532 | $4,316 | $1,188 | $3,128 |
Source: Public Records
Map
Nearby Homes
- 121 Hicks Dr
- 221 N Main St
- 119 Beechwood Dr
- 342 Carramore Dr
- 155 Wingo St
- 5 S Howard St
- 7 Lawrence St
- 26 Blackstock Rd
- 135 Glendarosa Dr
- 28 Blackstock Rd
- 318 Bellrock Rd
- 310 Bellrock Rd
- 314 Bellrock Rd
- 304 Bellrock Rd
- 322 Bellrock Rd
- 345 Bishop Hicks Ct
- 317 Bellrock Rd
- 329 Bellrock Rd
- 2 2nd St
- 325 Bellrock Rd
Your Personal Tour Guide
Ask me questions while you tour the home.