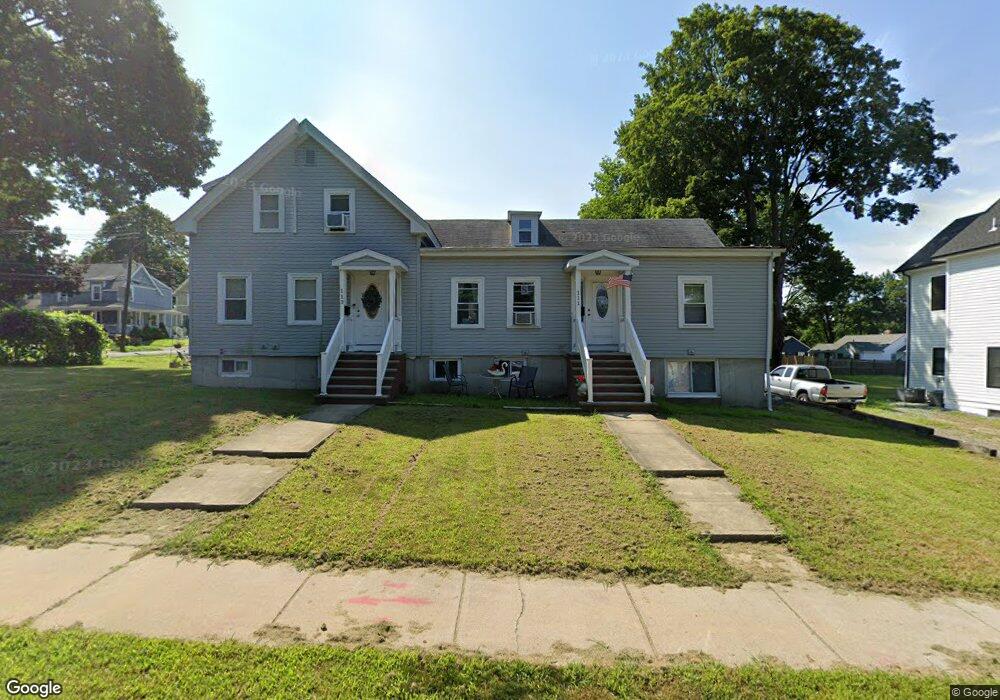
111 Elm St Unit 113 Stoneham, MA 02180
Colonial Park NeighborhoodEstimated Value: $892,825 - $959,000
About This Home
This home is located at 111 Elm St Unit 113, Stoneham, MA 02180 and is currently estimated at $931,956, approximately $386 per square foot. 111 Elm St Unit 113 is a home located in Middlesex County with nearby schools including Stoneham High School, St. Patrick Elementary School, and St Joseph School.
Ownership History
We collect this data history from publicly available records. To have your information removed, we recommend requesting removal directly through your county’s website.
Purchase Details
Purchase Details
Purchase Details
Home Values in the Area
Average Home Value in this Area
Purchase History
We collect this data history from publicly available records. To have your information removed, we recommend requesting removal directly through your county’s website.
| Date | Buyer | Sale Price | Title Company |
|---|---|---|---|
| -- | -- | ||
| -- | -- | ||
| -- | -- |
Mortgage History
We collect this data history from publicly available records. To have your information removed, we recommend requesting removal directly through your county’s website.
| Date | Status | Borrower | Loan Amount |
|---|---|---|---|
| Previous Owner | $51,000 |
Tax History
We collect this data history from publicly available records. To have your information removed, we recommend requesting removal directly through your county’s website.
| Year | Tax Paid | Tax Assessment Tax Assessment Total Assessment is a certain percentage of the fair market value that is determined by local assessors to be the total taxable value of land and additions on the property. | Land | Improvement |
|---|---|---|---|---|
| 2025 | $7,424 | $725,700 | $380,500 | $345,200 |
| 2024 | $7,367 | $695,700 | $350,500 | $345,200 |
| 2023 | $7,506 | $676,200 | $322,700 | $353,500 |
| 2022 | $6,727 | $646,200 | $292,700 | $353,500 |
| 2021 | $6,545 | $604,900 | $252,700 | $352,200 |
| 2020 | $6,401 | $593,200 | $242,700 | $350,500 |
| 2019 | $5,849 | $521,300 | $222,700 | $298,600 |
| 2018 | $5,834 | $498,200 | $222,700 | $275,500 |
| 2017 | $5,419 | $437,400 | $212,700 | $224,700 |
| 2016 | $5,366 | $422,500 | $212,700 | $209,800 |
| 2015 | $5,133 | $396,100 | $192,700 | $203,400 |
| 2014 | $5,010 | $371,400 | $172,700 | $198,700 |
Map
- 8 Brackett Ave
- 12 Brackett Ave
- 15 Garden Rd
- 17 Garden Rd
- 48 Macarthur Rd
- 124 Green St
- 165 Green St
- 5 Patrick Cir
- 269 Green St
- 380 Albion St
- 54 Endicott Rd
- 28 Washington St
- 62 High St Unit Lot 8
- 12 Thomas Cir
- 66 Spring St
- 159 Main St Unit 11C
- 159 Main St Unit 49A
- 159 Main St Unit 54A
- 1 Toms Way
- 122 Main St Unit 402
- 109 Elm St
- 109 Elm St Unit B
- 109 Elm St Unit A
- 110 Elm St
- 117 Elm St
- 17 Duncklee Ave
- 14 Duncklee Ave
- 119 Elm St
- 10 Penny Ln
- 20 Duncklee Ave
- 106 Elm St Unit 106 Elm First Fooor
- 20 Penny Ln
- 21 Duncklee Ave
- 24 Duncklee Ave
- 24 Duncklee Ave Unit 2
- 4 Macarthur Rd
- 22 Penny Ln
- 5 Norval Ave
- 7 Norval Ave
- 1 Norval Ave
Ask me questions while you tour the home.