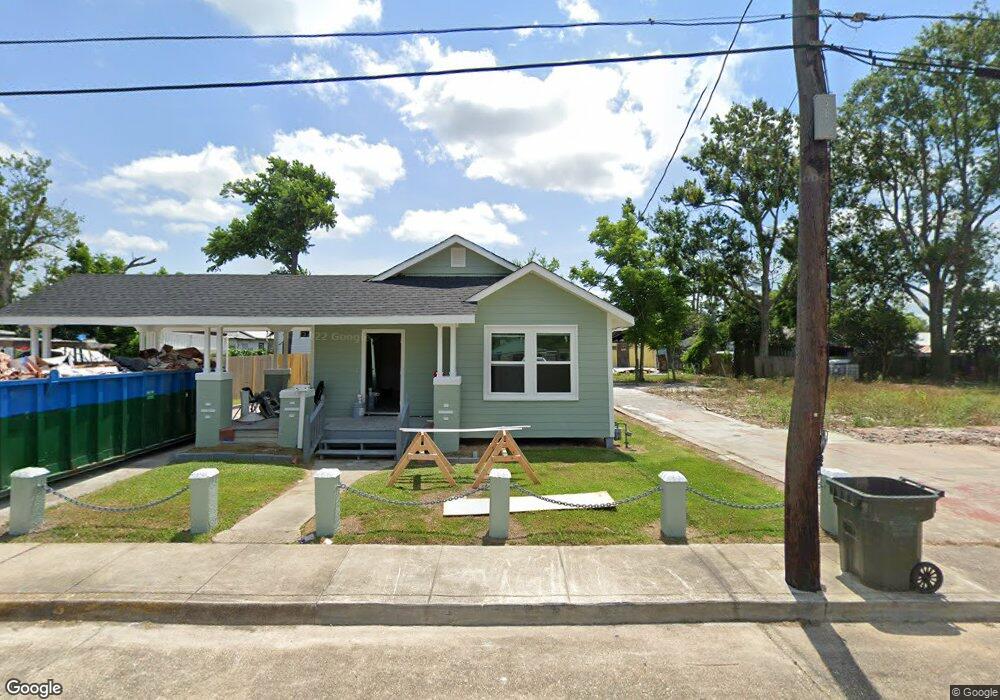
111 Engeron St Houma, LA 70363
Houma Heights NeighborhoodEstimated Value: $90,000 - $218,415
Studio
--
Bath
1,173
Sq Ft
$124/Sq Ft
Est. Value
About This Home
This home is located at 111 Engeron St, Houma, LA 70363 and is currently estimated at $145,354, approximately $123 per square foot. 111 Engeron St is a home located in Terrebonne Parish with nearby schools including Acadian Elementary School, Oaklawn Middle School, and Ellender Memorial High School.
Ownership History
Date
Name
Owned For
Owner Type
Purchase Details
Closed on
Aug 27, 2021
Sold by
Brown Caleb L
Bought by
Delco Nicole
Current Estimated Value
Home Financials for this Owner
Home Financials are based on the most recent Mortgage that was taken out on this home.
Original Mortgage
$128,282
Interest Rate
2.8%
Mortgage Type
Purchase Money Mortgage
Purchase Details
Closed on
Mar 26, 2021
Sold by
Richoux Royal J and Millet-Richoux Andree
Bought by
Brown Caleb L
Home Financials for this Owner
Home Financials are based on the most recent Mortgage that was taken out on this home.
Original Mortgage
$67,621
Interest Rate
3.1%
Mortgage Type
Purchase Money Mortgage
Create a Home Valuation Report for This Property
The Home Valuation Report is an in-depth analysis detailing your home's value as well as a comparison with similar homes in the area
Home Values in the Area
Average Home Value in this Area
Purchase History
| Date | Buyer | Sale Price | Title Company |
|---|---|---|---|
| Delco Nicole | $217,000 | None Available | |
| Brown Caleb L | $65,000 | None Available |
Source: Public Records
Mortgage History
| Date | Status | Borrower | Loan Amount |
|---|---|---|---|
| Previous Owner | Delco Nicole | $128,282 | |
| Previous Owner | Brown Caleb L | $67,621 |
Source: Public Records
Tax History
| Year | Tax Paid | Tax Assessment Tax Assessment Total Assessment is a certain percentage of the fair market value that is determined by local assessors to be the total taxable value of land and additions on the property. | Land | Improvement |
|---|---|---|---|---|
| 2024 | $103 | $6,270 | $1,460 | $4,810 |
| 2023 | $103 | $5,970 | $1,390 | $4,580 |
| 2022 | $98 | $5,970 | $1,390 | $4,580 |
| 2021 | $487 | $5,510 | $1,390 | $4,120 |
| 2020 | $507 | $5,970 | $1,390 | $4,580 |
| 2019 | $550 | $5,970 | $1,390 | $4,580 |
| 2018 | $533 | $5,680 | $1,320 | $4,360 |
| 2017 | $531 | $5,680 | $1,320 | $4,360 |
| 2015 | $408 | $5,405 | $1,255 | $4,150 |
| 2014 | $508 | $5,405 | $0 | $0 |
| 2013 | $509 | $5,405 | $0 | $0 |
Source: Public Records
Map
Nearby Homes
Your Personal Tour Guide
Ask me questions while you tour the home.