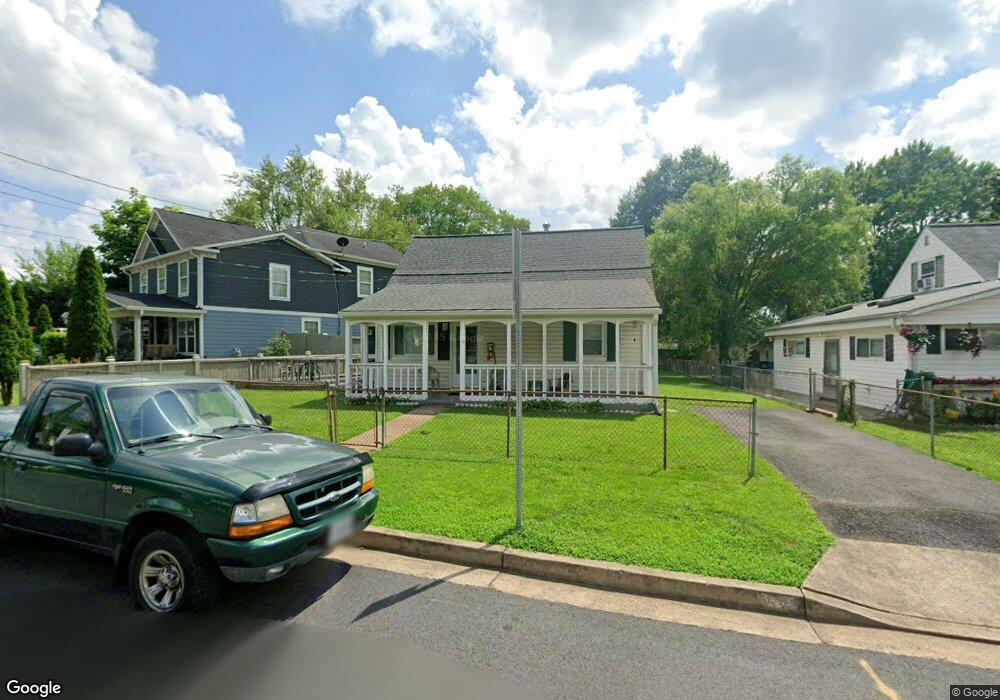
111 Evans St Manassas Park, VA 20111
Estimated Value: $394,000 - $407,000
3
Beds
1
Bath
1,025
Sq Ft
$390/Sq Ft
Est. Value
About This Home
This home is located at 111 Evans St, Manassas Park, VA 20111 and is currently estimated at $399,886, approximately $390 per square foot. 111 Evans St is a home located in Manassas Park City with nearby schools including Cougar Elementary School, Manassas Park Elementary School, and Manassas Park Middle School.
Ownership History
Date
Name
Owned For
Owner Type
Purchase Details
Closed on
Aug 31, 1998
Sold by
Snellings Norman T Estate Of
Bought by
Plumadore+ Stephanie S
Current Estimated Value
Home Financials for this Owner
Home Financials are based on the most recent Mortgage that was taken out on this home.
Original Mortgage
$87,423
Outstanding Balance
$18,675
Interest Rate
6.9%
Mortgage Type
FHA
Estimated Equity
$381,211
Create a Home Valuation Report for This Property
The Home Valuation Report is an in-depth analysis detailing your home's value as well as a comparison with similar homes in the area
Home Values in the Area
Average Home Value in this Area
Purchase History
| Date | Buyer | Sale Price | Title Company |
|---|---|---|---|
| Plumadore+ Stephanie S | $87,500 | -- |
Source: Public Records
Mortgage History
| Date | Status | Borrower | Loan Amount |
|---|---|---|---|
| Open | Plumadore+ Stephanie S | $87,423 |
Source: Public Records
Tax History Compared to Growth
Tax History
| Year | Tax Paid | Tax Assessment Tax Assessment Total Assessment is a certain percentage of the fair market value that is determined by local assessors to be the total taxable value of land and additions on the property. | Land | Improvement |
|---|---|---|---|---|
| 2025 | $4,598 | $372,500 | $145,000 | $227,500 |
| 2024 | $4,598 | $340,400 | $131,800 | $208,600 |
| 2023 | $4,598 | $315,200 | $105,400 | $209,800 |
| 2022 | $4,405 | $306,000 | $100,400 | $205,600 |
| 2021 | $4,175 | $278,100 | $87,300 | $190,800 |
| 2020 | $3,928 | $259,900 | $78,300 | $181,600 |
| 2019 | $3,928 | $244,000 | $72,700 | $171,300 |
| 2018 | $3,430 | $230,100 | $68,500 | $161,600 |
| 2017 | $3,330 | $219,100 | $68,500 | $150,600 |
| 2016 | $3,312 | $213,700 | $68,500 | $145,200 |
| 2015 | $2,354 | $199,700 | $68,500 | $131,200 |
| 2014 | $2,354 | $165,800 | $68,500 | $97,300 |
Source: Public Records
Map
Nearby Homes
- 132 Evans St
- 167 Scott Dr
- 8275 Vermont Place
- 8300 Sunnyside Ct
- 8321 Maplewood Dr
- 8319 Leighlex Ct
- 8020 Towering Oak Way
- 185 Cabbel Dr
- 8639 Union Place
- 8494 Kirby St
- 135 Polk Dr
- 9022 New Britain Cir
- 504 Tassita Ln
- 8605 Burnside Ct
- 8006 Well St
- 9058 Old Hickory Ct
- 8239 Glade Bank Dr
- 248 Manassas Dr
- 230 Cabbel Dr
- 8584 Liberia Ave