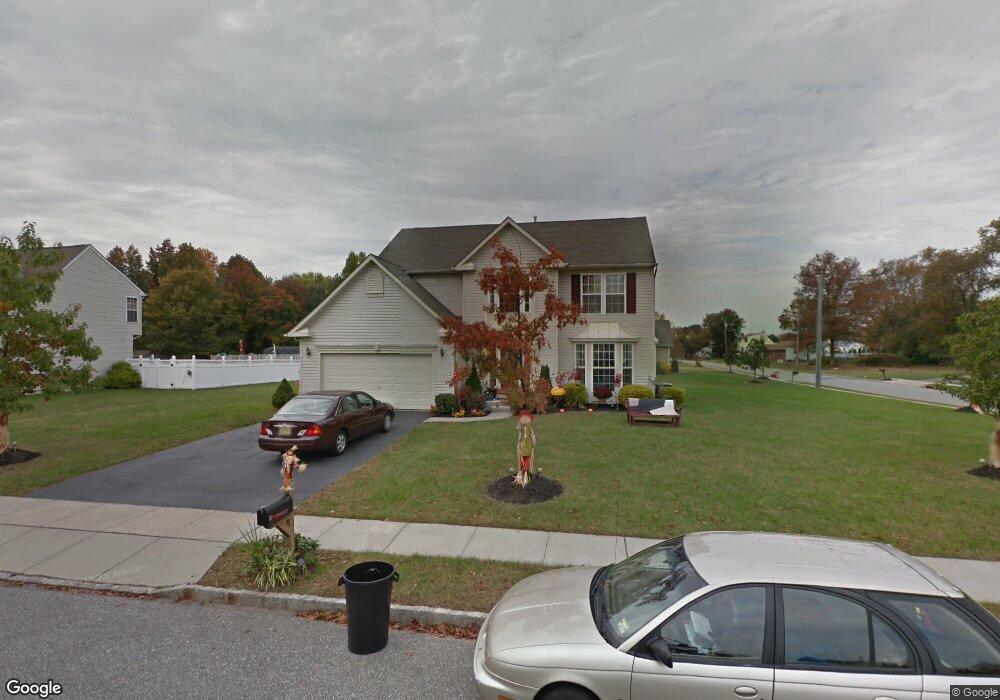
111 Fenton Dr Penns Grove, NJ 08069
Estimated Value: $306,526 - $488,000
--
Bed
--
Bath
2,238
Sq Ft
$173/Sq Ft
Est. Value
About This Home
This home is located at 111 Fenton Dr, Penns Grove, NJ 08069 and is currently estimated at $387,132, approximately $172 per square foot. 111 Fenton Dr is a home located in Salem County with nearby schools including Lafayette-Pershing Elementary School, Paul W. Carleton Elementary School, and Field Street Elementary School.
Ownership History
Date
Name
Owned For
Owner Type
Purchase Details
Closed on
Apr 21, 2005
Current Estimated Value
Home Financials for this Owner
Home Financials are based on the most recent Mortgage that was taken out on this home.
Original Mortgage
$195,950
Interest Rate
6.26%
Mortgage Type
Purchase Money Mortgage
Purchase Details
Closed on
Dec 10, 2004
Sold by
Lakeview Woods Llc
Bought by
Nvr Inc and Ryan Homes Delaware Division
Create a Home Valuation Report for This Property
The Home Valuation Report is an in-depth analysis detailing your home's value as well as a comparison with similar homes in the area
Home Values in the Area
Average Home Value in this Area
Purchase History
| Date | Buyer | Sale Price | Title Company |
|---|---|---|---|
| -- | $218,200 | -- | |
| Bailey Kimberly A | $218,165 | Legacy Title Agency Llc | |
| Nvr Inc | $93,000 | Title America Agency Corp |
Source: Public Records
Mortgage History
| Date | Status | Borrower | Loan Amount |
|---|---|---|---|
| Previous Owner | Bailey Kimberly A | $195,950 |
Source: Public Records
Tax History Compared to Growth
Tax History
| Year | Tax Paid | Tax Assessment Tax Assessment Total Assessment is a certain percentage of the fair market value that is determined by local assessors to be the total taxable value of land and additions on the property. | Land | Improvement |
|---|---|---|---|---|
| 2025 | $7,392 | $343,900 | $90,300 | $253,600 |
| 2024 | $7,138 | $200,500 | $38,200 | $162,300 |
| 2023 | $7,138 | $200,500 | $38,200 | $162,300 |
| 2022 | $6,717 | $200,500 | $38,200 | $162,300 |
| 2021 | $6,269 | $200,500 | $38,200 | $162,300 |
| 2020 | $6,711 | $200,500 | $38,200 | $162,300 |
| 2019 | $6,767 | $200,500 | $38,200 | $162,300 |
| 2018 | $7,183 | $228,100 | $51,200 | $176,900 |
| 2017 | $6,697 | $228,100 | $51,200 | $176,900 |
| 2016 | $6,419 | $226,900 | $58,200 | $168,700 |
| 2015 | $6,119 | $226,900 | $58,200 | $168,700 |
| 2014 | $5,793 | $226,900 | $58,200 | $168,700 |
Source: Public Records
Map
Nearby Homes