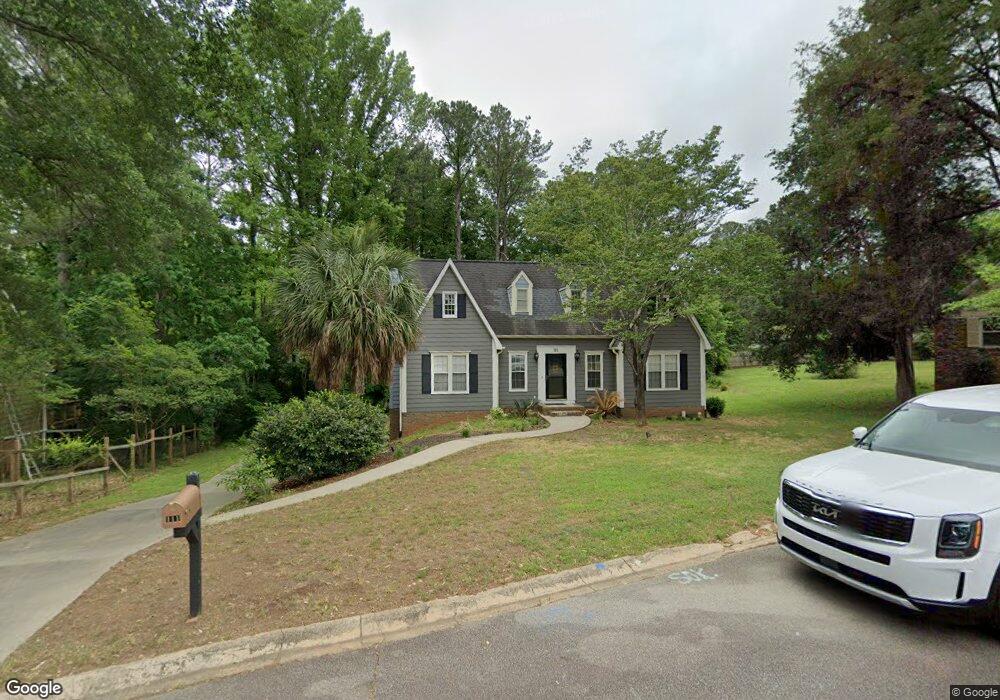
111 Graylock Ct Columbia, SC 29212
Northwest Columbia NeighborhoodEstimated Value: $281,000 - $291,000
3
Beds
3
Baths
2,237
Sq Ft
$128/Sq Ft
Est. Value
About This Home
This home is located at 111 Graylock Ct, Columbia, SC 29212 and is currently estimated at $285,940, approximately $127 per square foot. 111 Graylock Ct is a home located in Lexington County with nearby schools including Irmo Middle, Irmo High, and Green Charter School Of The Midlands.
Ownership History
Date
Name
Owned For
Owner Type
Purchase Details
Closed on
Aug 30, 2021
Sold by
Palmiter Kathryn and Hall Jesse
Bought by
Henderson Hollie and Henderson Stephen L
Current Estimated Value
Home Financials for this Owner
Home Financials are based on the most recent Mortgage that was taken out on this home.
Original Mortgage
$180,090
Outstanding Balance
$163,624
Interest Rate
2.7%
Mortgage Type
New Conventional
Estimated Equity
$122,316
Purchase Details
Closed on
Mar 18, 2014
Sold by
Eidson Lauri J and Eidson Alton H
Bought by
Palmiter Kathryn and Hall Jesse
Home Financials for this Owner
Home Financials are based on the most recent Mortgage that was taken out on this home.
Original Mortgage
$145,095
Interest Rate
4.37%
Mortgage Type
FHA
Purchase Details
Closed on
May 17, 2013
Sold by
Hunsicker Jonathan C
Bought by
Palmiter Kathryn and Hall Jesse
Home Financials for this Owner
Home Financials are based on the most recent Mortgage that was taken out on this home.
Original Mortgage
$144,827
Interest Rate
3.25%
Mortgage Type
FHA
Create a Home Valuation Report for This Property
The Home Valuation Report is an in-depth analysis detailing your home's value as well as a comparison with similar homes in the area
Home Values in the Area
Average Home Value in this Area
Purchase History
| Date | Buyer | Sale Price | Title Company |
|---|---|---|---|
| Henderson Hollie | $220,000 | None Available | |
| Palmiter Kathryn | -- | -- | |
| Palmiter Kathryn | $147,500 | -- |
Source: Public Records
Mortgage History
| Date | Status | Borrower | Loan Amount |
|---|---|---|---|
| Open | Henderson Hollie | $180,090 | |
| Previous Owner | Palmiter Kathryn | $145,095 | |
| Previous Owner | Palmiter Kathryn | $144,827 |
Source: Public Records
Tax History
| Year | Tax Paid | Tax Assessment Tax Assessment Total Assessment is a certain percentage of the fair market value that is determined by local assessors to be the total taxable value of land and additions on the property. | Land | Improvement |
|---|---|---|---|---|
| 2024 | $1,438 | $8,800 | $1,400 | $7,400 |
| 2023 | $1,348 | $8,800 | $1,400 | $7,400 |
| 2022 | $1,377 | $8,800 | $1,400 | $7,400 |
| 2020 | $1,030 | $6,321 | $1,331 | $4,990 |
| 2019 | $914 | $5,497 | $1,400 | $4,097 |
| 2018 | $803 | $5,497 | $1,400 | $4,097 |
| 2017 | $781 | $5,497 | $1,400 | $4,097 |
| 2016 | $803 | $5,496 | $1,400 | $4,096 |
| 2014 | $870 | $5,917 | $1,400 | $4,517 |
| 2013 | -- | $5,920 | $1,400 | $4,520 |
Source: Public Records
Map
Nearby Homes
- 123 Brent Ford Rd
- 124 Melville Rd
- 170 Cannon Dale Rd
- 1 Brittany Way
- 130 Ripley Station Rd
- 307 Heatherstone Rd
- 132 Laurel Branch Way
- 100 Ripley Station Rd
- 346 Heatherstone Rd
- 110 Thornhill Rd
- 344 Redstone Way
- 2141 Lake Murray Blvd
- 209 Doulton Way
- 525 Smiths Market Rd
- 110 Bilton Rd
- 215 Wilton Hill Rd
- 123 Stephenson Ln
- 140 Old Pond Ln
- 1720 Lake Murray Blvd
- 125 Old Pond Ln
- 113 Graylock Ct
- 107 Graylock Ct
- 116 Brentford Rd
- 112 Brentford Rd
- 120 Brent Ford Rd
- 112 Graylock Ct
- 108 Brentford Rd
- 108 Brent Ford Rd
- 133 Barnsley Rd
- 110 Graylock Ct
- 135 Melville Rd
- 124 Brent Ford Rd
- 124 Brentford Rd
- 129 Barnsley Rd
- 115 Brentford Rd
- 102 Brent Ford Cir
- 128 Brentford Rd
- 123 Melville Rd
- 123 Barnsley Rd
- 139 Melville Rd
Your Personal Tour Guide
Ask me questions while you tour the home.