Estimated Value: $407,000 - $487,000
--
Bed
1
Bath
3,368
Sq Ft
$131/Sq Ft
Est. Value
About This Home
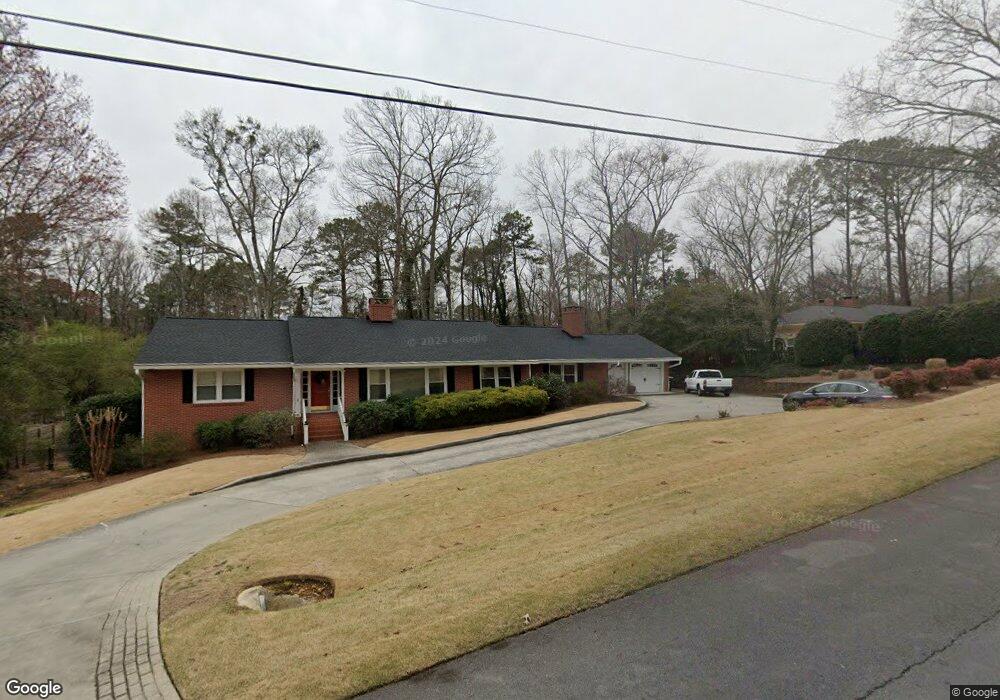
This home is located at 111 Green View Rd SW, Rome, GA 30165 and is currently estimated at $439,899, approximately $130 per square foot. 111 Green View Rd SW is a home located in Floyd County with nearby schools including Coosa Middle School, Coosa High School, and Darlington School.
Ownership History
Date
Name
Owned For
Owner Type
Purchase Details
Closed on
Jul 2, 2009
Sold by
Gordon Deborah D
Bought by
Gordon Dennett Howe
Current Estimated Value
Home Financials for this Owner
Home Financials are based on the most recent Mortgage that was taken out on this home.
Original Mortgage
$180,000
Outstanding Balance
$117,240
Interest Rate
5.27%
Mortgage Type
New Conventional
Estimated Equity
$322,659
Purchase Details
Closed on
Mar 23, 2001
Sold by
Pate Daniel D and Jill Newman
Bought by
Gordon Deborah D
Purchase Details
Closed on
Aug 30, 1991
Sold by
Brock Paul B and Brock Joan W
Bought by
Pate Daniel D and Jill Newman
Purchase Details
Closed on
Apr 27, 1988
Sold by
Murphy Groze
Bought by
Brock Paul B and Brock Joan W
Purchase Details
Closed on
Apr 6, 1978
Sold by
Barron A L
Bought by
Murphy Groze
Purchase Details
Closed on
Mar 1, 1971
Sold by
Lam Robert
Bought by
Barron A L
Purchase Details
Closed on
Jan 1, 1901
Bought by
Lam Robert
Create a Home Valuation Report for This Property
The Home Valuation Report is an in-depth analysis detailing your home's value as well as a comparison with similar homes in the area
Home Values in the Area
Average Home Value in this Area
Purchase History
| Date | Buyer | Sale Price | Title Company |
|---|---|---|---|
| Gordon Dennett Howe | -- | -- | |
| Gordon Deborah D | $195,000 | -- | |
| Pate Daniel D | $141,500 | -- | |
| Brock Paul B | $135,000 | -- | |
| Murphy Groze | $57,500 | -- | |
| Barron A L | $34,200 | -- | |
| Lam Robert | -- | -- |
Source: Public Records
Mortgage History
| Date | Status | Borrower | Loan Amount |
|---|---|---|---|
| Open | Gordon Dennett Howe | $180,000 |
Source: Public Records
Tax History Compared to Growth
Tax History
| Year | Tax Paid | Tax Assessment Tax Assessment Total Assessment is a certain percentage of the fair market value that is determined by local assessors to be the total taxable value of land and additions on the property. | Land | Improvement |
|---|---|---|---|---|
| 2024 | $3,548 | $174,726 | $19,059 | $155,667 |
| 2023 | $3,553 | $169,429 | $17,214 | $152,215 |
| 2022 | $3,142 | $144,232 | $14,140 | $130,092 |
| 2021 | $2,769 | $120,758 | $14,140 | $106,618 |
| 2020 | $2,148 | $113,428 | $10,759 | $102,669 |
| 2019 | $2,738 | $109,244 | $10,759 | $98,485 |
| 2018 | $2,663 | $104,823 | $10,759 | $94,064 |
| 2017 | $2,465 | $93,725 | $10,759 | $82,966 |
| 2016 | $2,481 | $92,960 | $10,720 | $82,240 |
| 2015 | $2,392 | $90,383 | $10,720 | $79,663 |
| 2014 | $2,392 | $90,383 | $10,720 | $79,663 |
Source: Public Records
Map
Nearby Homes
- 28 Crestwood Dr SW
- 202 Green View Rd SW
- 0 Featherston Rd SW Unit 10512723
- 0 Featherston Rd SW Unit 13890394
- 5 Andrea Ct SW
- 20 Pine Valley Rd SW
- 11 Brow Rd SW
- 0 Hidden Ridge Dr Unit 10556470
- 0 Hidden Ridge Dr Unit 10343706
- 0 Hidden Ridge Dr Unit 10343701
- 0 Hidden Ridge Dr Unit 10343700
- 0 Hidden Ridge Dr Unit 10343696
- 0 Hidden Ridge Dr Unit 10343694
- 0 Hidden Ridge Dr Unit 10343693
- 0 Hidden Ridge Dr Unit 10343689
- 0 Hidden Ridge Dr Unit 10343688
- 0 Hidden Ridge Dr Unit 10343685
- 0 Hidden Ridge Dr Unit 10343680
- 0 Hidden Ridge Dr Unit 10343676
- 25 Blacks Bluff Rd SW
- 109 Green View Rd SW
- 113 Green View Rd SW
- 113 Green View Rd SW Unit 32
- 0 Green View Rd SW Unit 8448073
- 0 Green View Rd SW Unit 8027397
- 0 Green View Rd SW Unit 9033118
- 0 Green View Rd SW Unit 3145187
- 0 Green View Rd SW Unit 7303154
- 0 Green View Rd SW Unit 7419829
- 0 Green View Rd SW
- 21 Crestwood Dr SW
- 107 Green View Rd SW
- 115 Green View Rd SW
- 100 Green View Rd SW
- 103 Pine Valley Rd SW
- 19 Crestwood Dr SW
- 105 Pine Valley Rd SW
- 105 Green View Rd SW
- 26 Crestwood Dr SW Unit 17 & 36
- 26 Crestwood Dr SW