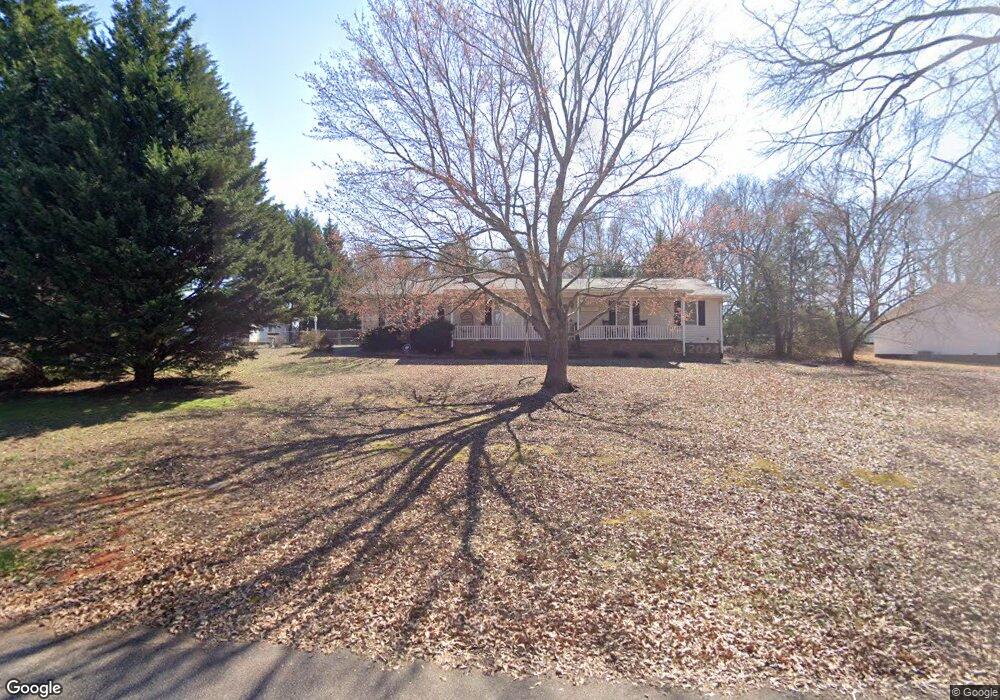
111 Jackie Ct Spartanburg, SC 29307
Estimated Value: $221,000 - $261,000
3
Beds
2
Baths
1,641
Sq Ft
$148/Sq Ft
Est. Value
About This Home
This home is located at 111 Jackie Ct, Spartanburg, SC 29307 and is currently estimated at $242,130, approximately $147 per square foot. 111 Jackie Ct is a home located in Spartanburg County with nearby schools including Carlisle-Foster's Grove Elementary School, Rainbow Lake Middle School, and Boiling Springs High School.
Ownership History
Date
Name
Owned For
Owner Type
Purchase Details
Closed on
Nov 23, 2009
Sold by
Haines James L and Haines Patricia
Bought by
Rolfe Harold J
Current Estimated Value
Home Financials for this Owner
Home Financials are based on the most recent Mortgage that was taken out on this home.
Original Mortgage
$115,920
Outstanding Balance
$75,614
Interest Rate
4.98%
Mortgage Type
Future Advance Clause Open End Mortgage
Estimated Equity
$166,516
Purchase Details
Closed on
May 30, 2007
Sold by
Haines James L
Bought by
Haines James L and Haines Patricia
Purchase Details
Closed on
Sep 15, 2006
Sold by
Seay Mark H and Seay Denise E
Bought by
Haines James L
Home Financials for this Owner
Home Financials are based on the most recent Mortgage that was taken out on this home.
Original Mortgage
$20,250
Interest Rate
6.48%
Mortgage Type
Credit Line Revolving
Create a Home Valuation Report for This Property
The Home Valuation Report is an in-depth analysis detailing your home's value as well as a comparison with similar homes in the area
Home Values in the Area
Average Home Value in this Area
Purchase History
| Date | Buyer | Sale Price | Title Company |
|---|---|---|---|
| Rolfe Harold J | $115,920 | -- | |
| Haines James L | -- | None Available | |
| Haines James L | $135,000 | None Available |
Source: Public Records
Mortgage History
| Date | Status | Borrower | Loan Amount |
|---|---|---|---|
| Open | Rolfe Harold J | $115,920 | |
| Previous Owner | Haines James L | $20,250 | |
| Previous Owner | Haines James L | $108,000 |
Source: Public Records
Tax History Compared to Growth
Tax History
| Year | Tax Paid | Tax Assessment Tax Assessment Total Assessment is a certain percentage of the fair market value that is determined by local assessors to be the total taxable value of land and additions on the property. | Land | Improvement |
|---|---|---|---|---|
| 2025 | $971 | $7,348 | $946 | $6,402 |
| 2024 | $971 | $7,348 | $946 | $6,402 |
| 2023 | $971 | $7,348 | $946 | $6,402 |
| 2022 | $824 | $6,389 | $716 | $5,673 |
| 2021 | $824 | $6,389 | $716 | $5,673 |
| 2020 | $809 | $6,389 | $716 | $5,673 |
| 2019 | $803 | $6,389 | $716 | $5,673 |
| 2018 | $782 | $6,389 | $716 | $5,673 |
| 2017 | $646 | $5,556 | $720 | $4,836 |
| 2016 | $972 | $5,556 | $720 | $4,836 |
| 2015 | $965 | $5,556 | $720 | $4,836 |
| 2014 | $616 | $5,476 | $720 | $4,756 |
Source: Public Records
Map
Nearby Homes
- 451 Old Chesnee Hwy
- 455 Old Chesnee Hwy
- 2959 Chesnee Hwy
- 459 Old Chesnee Hwy
- 49 Thurgood Marshall Rd
- 415 Ware Rd
- 299 Sequoyah Dr
- 150 Ware Rd
- 134 Harvest Moon Ln
- 230 S Pointe
- 325 R C Thompson Rd
- 2741 Sandy Ford Rd
- 1170 Fosters Grove Rd
- 576 Thorn Cove Dr
- 5031 Radley Rd
- 2701 Sandy Ford Rd
- 000 Burns Rd Unit LOT 1
- 000 Burns Rd
- 000 Burns Rd Unit LOT 2
- Lot 20 Peach Valley Cir
- 1 Jackie Ct
- 165 Green River Rd
- 115 Jackie Ct
- 157 Green River Rd
- 108 Jackie Ct
- 177 Green River Rd
- 106 Jackie Ct
- 112 Jackie Ct
- 149 Green River Rd
- 135 Green River Rd
- 141 Green River Rd
- 224 Easler Dr
- 232 Easler Dr
- 220 Easler Dr
- 120 Jackie Ct
- 102 Jackie Ct
- 125 Green River Rd
- 242 Easler Dr
- 238 Easler Dr
- 214 Easler Dr Unit 216