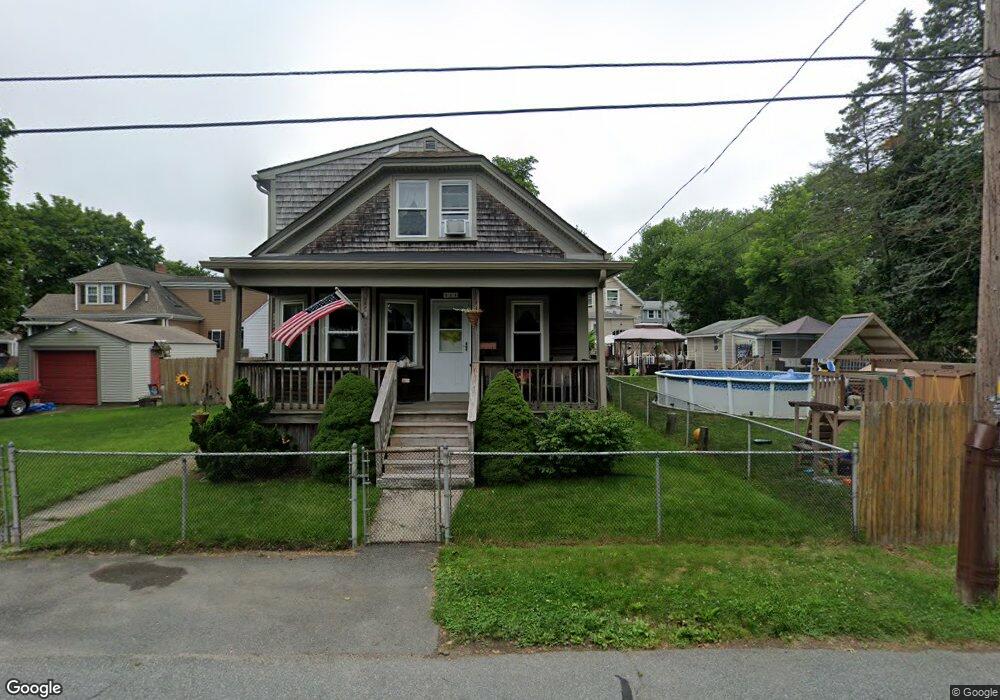
111 James St Acushnet, MA 02743
Estimated Value: $396,320 - $472,000
Studio
1
Bath
1,512
Sq Ft
$289/Sq Ft
Est. Value
About This Home
This home is located at 111 James St, Acushnet, MA 02743 and is currently estimated at $436,580, approximately $288 per square foot. 111 James St is a home located in Bristol County with nearby schools including Acushnet Elementary School, Albert F Ford Middle School, and Alma Del Mar Charter School.
Ownership History
Date
Name
Owned For
Owner Type
Purchase Details
Closed on
Dec 5, 2018
Sold by
Deneault David P and Deneault Monique A
Bought by
David Paul Deneault Lt and Deneault
Current Estimated Value
Purchase Details
Closed on
Oct 29, 1987
Sold by
Michon Debra A
Bought by
Deneault David P
Home Financials for this Owner
Home Financials are based on the most recent Mortgage that was taken out on this home.
Original Mortgage
$79,500
Interest Rate
10.97%
Mortgage Type
Purchase Money Mortgage
Create a Home Valuation Report for This Property
The Home Valuation Report is an in-depth analysis detailing your home's value as well as a comparison with similar homes in the area
Home Values in the Area
Average Home Value in this Area
Purchase History
| Date | Buyer | Sale Price | Title Company |
|---|---|---|---|
| David Paul Deneault Lt | -- | -- | |
| Deneault David P | $99,500 | -- |
Source: Public Records
Mortgage History
| Date | Status | Borrower | Loan Amount |
|---|---|---|---|
| Previous Owner | Deneault David P | $62,000 | |
| Previous Owner | Deneault David P | $64,030 | |
| Previous Owner | Deneault David P | $78,000 | |
| Previous Owner | Deneault David P | $79,500 |
Source: Public Records
Tax History
| Year | Tax Paid | Tax Assessment Tax Assessment Total Assessment is a certain percentage of the fair market value that is determined by local assessors to be the total taxable value of land and additions on the property. | Land | Improvement |
|---|---|---|---|---|
| 2025 | $37 | $345,400 | $94,200 | $251,200 |
| 2024 | $3,721 | $326,100 | $90,100 | $236,000 |
| 2023 | $3,791 | $315,900 | $81,900 | $234,000 |
| 2022 | $3,739 | $281,800 | $77,800 | $204,000 |
| 2021 | $2,473 | $234,600 | $77,800 | $156,800 |
| 2020 | $3,270 | $234,600 | $77,800 | $156,800 |
| 2019 | $9,176 | $222,200 | $77,800 | $144,400 |
| 2018 | $3,047 | $211,300 | $77,800 | $133,500 |
| 2017 | $2,648 | $204,000 | $77,800 | $126,200 |
| 2016 | $2,964 | $204,000 | $77,800 | $126,200 |
| 2015 | $2,717 | $190,300 | $77,800 | $112,500 |
Source: Public Records
Map
Nearby Homes
- 14 Hayes St Unit 1
- 12 Hayes St Unit 1
- 12 White St
- 11 Boylston St
- 0 Hathaway Rd Unit 73469544
- 91 S Main St
- 23 Oliveira Ave
- 122 Truro St
- 25 Pershing Ave
- 81 Sylvia St
- 112 Lawson Ave
- 20 Jake Ln
- 4 Sam St
- 34 Chicopee St
- 5 William St
- 14 Caswell St
- 27 Meadow Ln
- 15 Ball St
- 1940-1942 Acushnet Ave
- 65 Armsby St
Your Personal Tour Guide
Ask me questions while you tour the home.