Estimated Value: $215,838 - $271,000
--
Bed
--
Bath
1,491
Sq Ft
$162/Sq Ft
Est. Value
About This Home
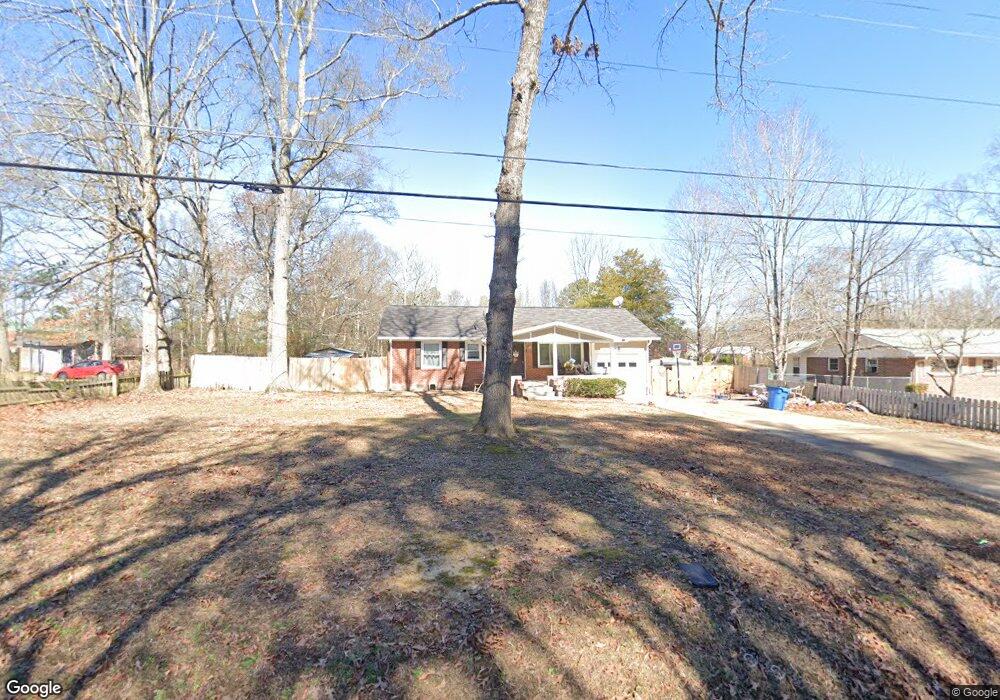
This home is located at 111 Jones Bend Rd NE, Rome, GA 30165 and is currently estimated at $241,210, approximately $161 per square foot. 111 Jones Bend Rd NE is a home located in Floyd County with nearby schools including Armuchee Middle School, Armuchee High School, and Unity Christian School.
Ownership History
Date
Name
Owned For
Owner Type
Purchase Details
Closed on
Nov 27, 2019
Sold by
Abdellatif Ayman
Bought by
Abdellatif Nizar A and Abdellatif Muhammad N
Current Estimated Value
Home Financials for this Owner
Home Financials are based on the most recent Mortgage that was taken out on this home.
Original Mortgage
$120,000
Outstanding Balance
$105,203
Interest Rate
3.7%
Mortgage Type
New Conventional
Estimated Equity
$136,007
Purchase Details
Closed on
Aug 26, 2002
Sold by
Moore James T and Moore Jennice
Bought by
Abdellatif Ayman
Purchase Details
Closed on
Dec 8, 1992
Sold by
Moore James T
Bought by
Moore James T and Moore Jennice
Purchase Details
Closed on
May 23, 1989
Sold by
Leroy Sandra M
Bought by
Moore James T
Purchase Details
Closed on
Jan 6, 1983
Sold by
Hibbs Mrs Jewell T
Bought by
Leroy Sandra M
Purchase Details
Closed on
Sep 1, 1966
Sold by
Woodfin James W
Bought by
Hibbs Mrs Jewell T
Purchase Details
Closed on
Jan 1, 1960
Bought by
Woodfin James W
Create a Home Valuation Report for This Property
The Home Valuation Report is an in-depth analysis detailing your home's value as well as a comparison with similar homes in the area
Home Values in the Area
Average Home Value in this Area
Purchase History
| Date | Buyer | Sale Price | Title Company |
|---|---|---|---|
| Abdellatif Nizar A | $150,000 | -- | |
| Abdellatif Ayman | $90,000 | -- | |
| Moore James T | -- | -- | |
| Moore James T | $48,500 | -- | |
| Leroy Sandra M | $23,500 | -- | |
| Hibbs Mrs Jewell T | $12,900 | -- | |
| Woodfin James W | -- | -- |
Source: Public Records
Mortgage History
| Date | Status | Borrower | Loan Amount |
|---|---|---|---|
| Open | Abdellatif Nizar A | $120,000 |
Source: Public Records
Tax History Compared to Growth
Tax History
| Year | Tax Paid | Tax Assessment Tax Assessment Total Assessment is a certain percentage of the fair market value that is determined by local assessors to be the total taxable value of land and additions on the property. | Land | Improvement |
|---|---|---|---|---|
| 2024 | $2,420 | $83,066 | $7,208 | $75,858 |
| 2023 | $2,377 | $80,272 | $6,360 | $73,912 |
| 2022 | $1,997 | $67,322 | $5,088 | $62,234 |
| 2021 | $1,742 | $57,728 | $5,088 | $52,640 |
| 2020 | $1,541 | $50,638 | $3,816 | $46,822 |
| 2019 | $1,166 | $46,700 | $3,816 | $42,884 |
| 2018 | $1,098 | $42,887 | $3,816 | $39,071 |
| 2017 | $896 | $32,902 | $3,816 | $29,086 |
| 2016 | $947 | $34,200 | $3,800 | $30,400 |
| 2015 | $973 | $34,640 | $3,800 | $30,840 |
| 2014 | $973 | $36,299 | $3,800 | $32,499 |
Source: Public Records
Map
Nearby Homes
- KERRY Plan at Northberry
- BELHAVEN Plan at Northberry
- CALI Plan at Northberry
- ROBIE Plan at Northberry
- ARIA Plan at Northberry
- 21 Coggins Place NE
- 27 Coggins Place NE
- 29 Coggins Place NE
- 15 Coggins Place NE
- 3 Babcock Dr NE
- 13 Coggins Place NE
- 11 Coggins Place NE
- 12 Coggins Place NE
- 9 Coggins Place NE
- 10 Coggins Place NE
- 8 Babcock Dr NE
- 121 Jones Bend Rd NE
- 95 Jones Bend Rd NE
- 3 Johns Dr NE
- 2 Johns Dr NE
- 2 Johns Dr NE
- 2 Johns Dr NE Unit 3-4
- 5 Johns Dr NE
- 81 Jones Bend Rd NE
- 4 Johns Dr NE
- 4 Johns Dr NE
- 7 Johns Dr NE
- 0 Glenwood School Rd NE Unit 8565743
- 0 Glenwood School Rd NE Unit 8261160
- 0 Glenwood School Rd NE
- 71 Jones Bend Rd NE
- 155 Jones Bend Rd NE
- 54 Glenwood School Rd NE
- 9 Johns Dr NE
- 59 Jones Bend Rd NE
- 163 Jones Bend Rd NE