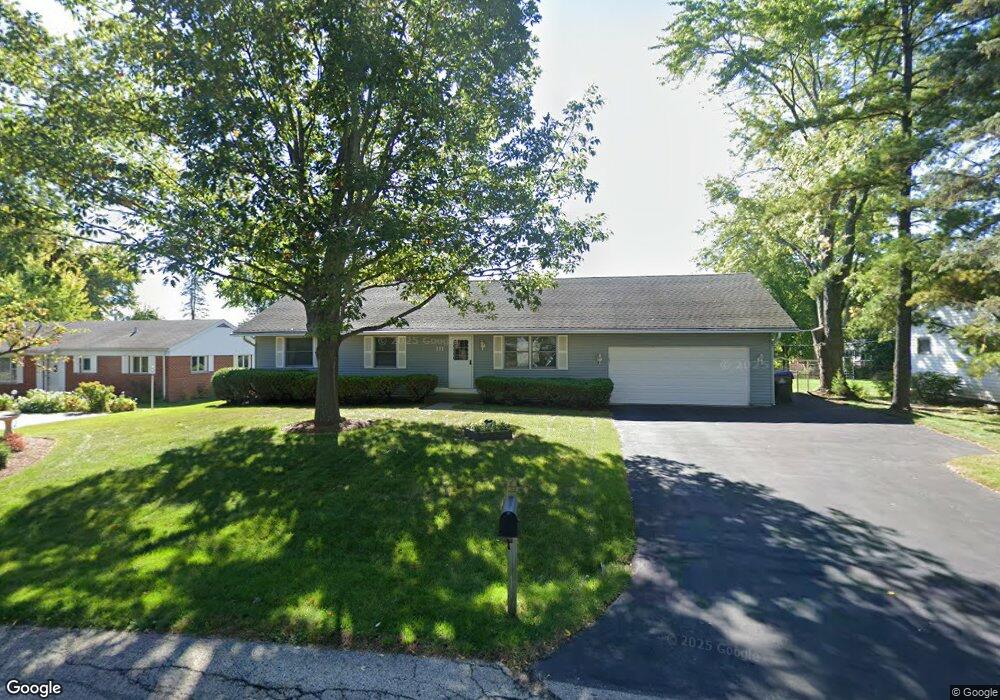
111 Kohl Ave Spring Grove, IL 60081
Northwest Fox Lake NeighborhoodEstimated Value: $248,000 - $317,000
Studio
--
Bath
1,600
Sq Ft
$174/Sq Ft
Est. Value
About This Home
This home is located at 111 Kohl Ave, Spring Grove, IL 60081 and is currently estimated at $279,053, approximately $174 per square foot. 111 Kohl Ave is a home located in McHenry County with nearby schools including Spring Grove Elementary School, Nippersink Middle School, and Richmond-Burton High School.
Ownership History
Date
Name
Owned For
Owner Type
Purchase Details
Closed on
Dec 29, 1999
Sold by
Walker William K and Walker Tina Marie
Bought by
Zura Daniel S
Current Estimated Value
Home Financials for this Owner
Home Financials are based on the most recent Mortgage that was taken out on this home.
Original Mortgage
$120,000
Outstanding Balance
$37,898
Interest Rate
7.76%
Estimated Equity
$241,155
Purchase Details
Closed on
Jun 30, 1994
Sold by
Bsr Partnership
Bought by
Walker William K and Walker Tina Marie
Home Financials for this Owner
Home Financials are based on the most recent Mortgage that was taken out on this home.
Original Mortgage
$111,200
Interest Rate
6.75%
Purchase Details
Closed on
Jan 22, 1994
Sold by
Ray Timothy C and Holterman Ann M
Bought by
B S R Partnership
Home Financials for this Owner
Home Financials are based on the most recent Mortgage that was taken out on this home.
Original Mortgage
$97,000
Interest Rate
7.1%
Create a Home Valuation Report for This Property
The Home Valuation Report is an in-depth analysis detailing your home's value as well as a comparison with similar homes in the area
Home Values in the Area
Average Home Value in this Area
Purchase History
| Date | Buyer | Sale Price | Title Company |
|---|---|---|---|
| Zura Daniel S | $154,000 | Chicago Title Insurance Co | |
| Walker William K | $139,000 | -- | |
| B S R Partnership | $23,500 | -- |
Source: Public Records
Mortgage History
| Date | Status | Borrower | Loan Amount |
|---|---|---|---|
| Open | Zura Daniel S | $120,000 | |
| Previous Owner | Walker William K | $111,200 | |
| Previous Owner | B S R Partnership | $97,000 |
Source: Public Records
Tax History
| Year | Tax Paid | Tax Assessment Tax Assessment Total Assessment is a certain percentage of the fair market value that is determined by local assessors to be the total taxable value of land and additions on the property. | Land | Improvement |
|---|---|---|---|---|
| 2024 | $5,577 | $85,600 | $10,534 | $75,066 |
| 2023 | $5,530 | $79,836 | $9,825 | $70,011 |
| 2022 | $5,242 | $70,229 | $8,643 | $61,586 |
| 2021 | $4,971 | $66,204 | $8,148 | $58,056 |
| 2020 | $4,852 | $63,287 | $7,789 | $55,498 |
| 2019 | $4,885 | $62,303 | $7,668 | $54,635 |
| 2018 | $4,985 | $60,377 | $7,431 | $52,946 |
| 2017 | $4,907 | $56,697 | $6,978 | $49,719 |
| 2016 | $4,920 | $54,147 | $6,664 | $47,483 |
| 2013 | -- | $50,892 | $5,531 | $45,361 |
Source: Public Records
Map
Nearby Homes
- 23 Jamaica Colony Unit 5
- 47 Nassau Colony Unit 1
- 11 Saint Thomas Colony Unit 7
- 35 Montego Colony Unit 7
- 63 Aspen Colony Unit 8
- 40 Bermuda Colony Unit 7
- 16 Saint Thomas Colony Unit 6
- 49 Oak Hill Colony Unit 12
- 55 Vail Colony Unit 6
- 6421 Cherrywood Ct Unit 232
- 530 Main Street Rd
- 6415 N Shore Ave
- 7503 Windsor Ave
- 38265 N State Park Rd
- 535 Deer Run
- 7202 Oxford Cir Unit 237
- 7411 Leisure Village Ave Unit 198
- 7302 Chevy Chase Ct Unit 51
- 7105 Saint Tropez Ct Unit 297
- 7408 Chevy Chase Ct Unit 64
Your Personal Tour Guide
Ask me questions while you tour the home.