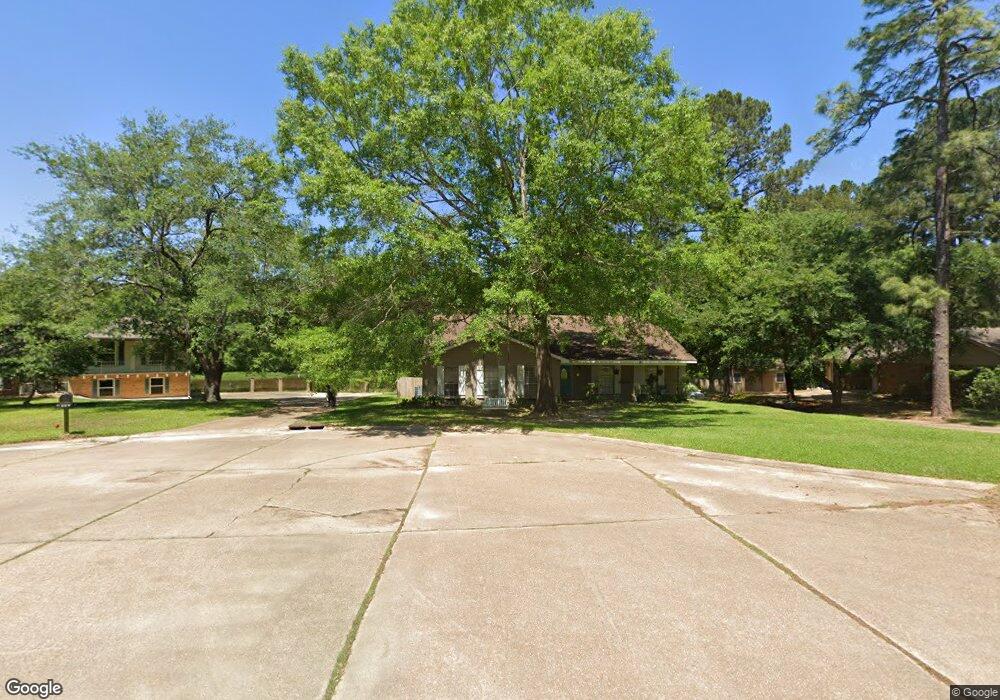
111 Lakeshore Cove Pineville, LA 71360
Estimated Value: $186,000 - $262,082
4
Beds
3
Baths
2,457
Sq Ft
$94/Sq Ft
Est. Value
About This Home
This home is located at 111 Lakeshore Cove, Pineville, LA 71360 and is currently estimated at $231,771, approximately $94 per square foot. 111 Lakeshore Cove is a home located in Rapides Parish with nearby schools including J.I. Barron Sr. Elementary School, Pineville Junior High School, and Pineville High School.
Ownership History
Date
Name
Owned For
Owner Type
Purchase Details
Closed on
Jan 31, 2011
Sold by
Hamilton Michael Scott and Hamilton Donna Michelle
Bought by
Huffman Jeremy Curtis and Huffman Tabitha Elizabeth Bryant
Current Estimated Value
Home Financials for this Owner
Home Financials are based on the most recent Mortgage that was taken out on this home.
Original Mortgage
$155,440
Outstanding Balance
$106,767
Interest Rate
4.86%
Mortgage Type
New Conventional
Estimated Equity
$125,004
Purchase Details
Closed on
Aug 10, 2006
Sold by
Sweat John Michael and Sweat Sheryl Presley
Bought by
Townley Timothy Nathan and Townley Kimberly Ellen Neal
Home Financials for this Owner
Home Financials are based on the most recent Mortgage that was taken out on this home.
Original Mortgage
$133,200
Interest Rate
6.75%
Mortgage Type
New Conventional
Create a Home Valuation Report for This Property
The Home Valuation Report is an in-depth analysis detailing your home's value as well as a comparison with similar homes in the area
Home Values in the Area
Average Home Value in this Area
Purchase History
| Date | Buyer | Sale Price | Title Company |
|---|---|---|---|
| Huffman Jeremy Curtis | $150,000 | None Available | |
| Townley Timothy Nathan | $148,000 | None Available |
Source: Public Records
Mortgage History
| Date | Status | Borrower | Loan Amount |
|---|---|---|---|
| Open | Huffman Jeremy Curtis | $155,440 | |
| Previous Owner | Townley Timothy Nathan | $133,200 |
Source: Public Records
Tax History Compared to Growth
Tax History
| Year | Tax Paid | Tax Assessment Tax Assessment Total Assessment is a certain percentage of the fair market value that is determined by local assessors to be the total taxable value of land and additions on the property. | Land | Improvement |
|---|---|---|---|---|
| 2024 | $1,398 | $18,200 | $2,400 | $15,800 |
| 2023 | $1,355 | $17,300 | $2,300 | $15,000 |
| 2022 | $2,227 | $17,300 | $2,300 | $15,000 |
| 2021 | $2,253 | $17,300 | $2,300 | $15,000 |
| 2020 | $2,267 | $17,300 | $2,300 | $15,000 |
| 2019 | $2,075 | $16,000 | $2,100 | $13,900 |
| 2018 | $1,094 | $16,000 | $2,100 | $13,900 |
| 2017 | $1,073 | $16,000 | $2,100 | $13,900 |
| 2016 | $2,020 | $16,000 | $2,100 | $13,900 |
| 2015 | $1,918 | $15,000 | $2,000 | $13,000 |
| 2014 | $1,910 | $15,000 | $2,000 | $13,000 |
| 2013 | $1,861 | $15,000 | $2,000 | $13,000 |
Source: Public Records
Map
Nearby Homes
- 210 Fendler Pkwy
- 334 Fendler Pkwy
- 206 Fendler Pkwy
- 614 Fendler Pkwy
- 108 Lodge Hill Cir
- 4410 Walden Dr
- 417 Fendler Pkwy
- 110 E Deer Creek East Dr
- 154 Woodlake Dr
- 193 Sunny Hill Dr
- 3001 Legacy Loop
- 2005 Legacy Loop
- 304 Holiday Cir
- 308 Holiday Cir
- 4033 Legacy Loop
- 0 Richfield Place
- 208 Susan Gay St
- 0 Richfield Place None
- 1805 Susek Dr
- 4306 Hwy 28e Hwy
- 110 Lakeshore Cove
- 107 Lakeshore Cove
- 106 Lakeshore Cove
- 114 Lakeshore Cove
- 115 Lakeshore Cove
- 115 Lakeshore Cove
- 718 Fendler Pkwy
- 116 Lakeshore Cove
- 103 Lakeshore Cove
- 102 Lakeshore Cove
- 101 Lakeshore Cove
- 5906 Cherokee Ln
- 722 Fendler Pkwy
- 251 Fendler Pkwy
- 359 Twin Oaks Rd E
- 356 Twin Oaks Rd E
- 716 Fendler Pkwy
- 243 Fendler Pkwy
- 349 Twin Oaks Rd E
- 352 Twin Oaks Rd E