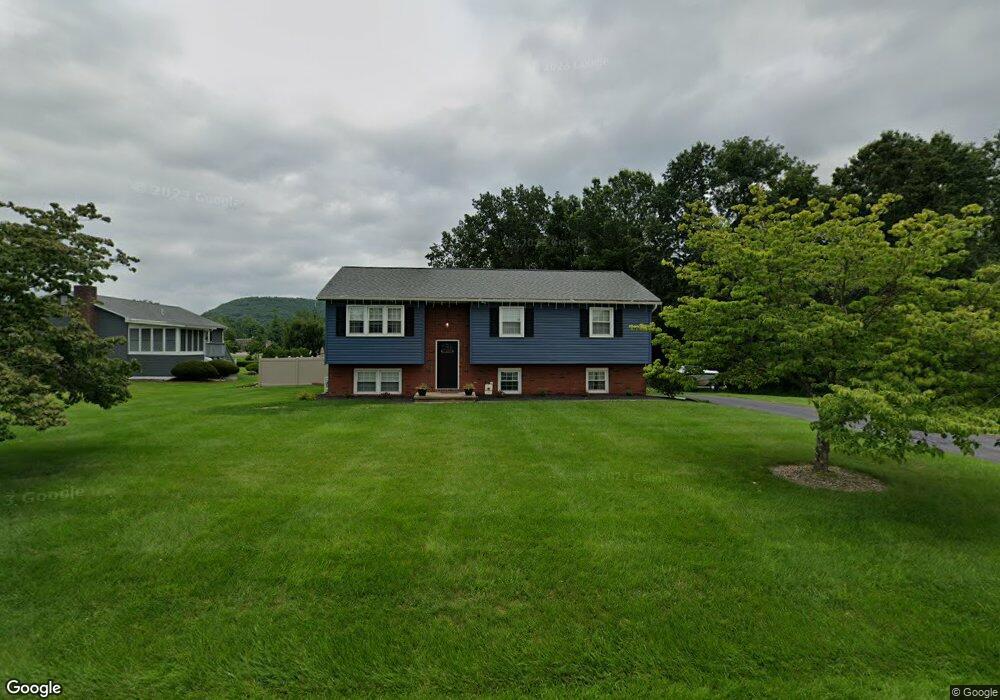
111 Logan Ln Hughesville, PA 17737
Estimated Value: $217,487 - $280,000
3
Beds
2
Baths
1,216
Sq Ft
$209/Sq Ft
Est. Value
About This Home
This home is located at 111 Logan Ln, Hughesville, PA 17737 and is currently estimated at $254,372, approximately $209 per square foot. 111 Logan Ln is a home located in Lycoming County with nearby schools including Hughesville Junior/Senior High School.
Ownership History
Date
Name
Owned For
Owner Type
Purchase Details
Closed on
Dec 3, 2010
Sold by
Barrows Michele R and Barrows Shannon D
Bought by
Farley Scott S and Farley Alison M
Current Estimated Value
Home Financials for this Owner
Home Financials are based on the most recent Mortgage that was taken out on this home.
Original Mortgage
$154,969
Outstanding Balance
$102,541
Interest Rate
4.25%
Mortgage Type
FHA
Estimated Equity
$151,831
Purchase Details
Closed on
Jul 26, 2004
Sold by
Nixon Michele R and Barrows Shannon D
Bought by
Barrows Michele R and Barrows Shannon D
Home Financials for this Owner
Home Financials are based on the most recent Mortgage that was taken out on this home.
Original Mortgage
$140,000
Interest Rate
6.73%
Mortgage Type
New Conventional
Create a Home Valuation Report for This Property
The Home Valuation Report is an in-depth analysis detailing your home's value as well as a comparison with similar homes in the area
Home Values in the Area
Average Home Value in this Area
Purchase History
| Date | Buyer | Sale Price | Title Company |
|---|---|---|---|
| Farley Scott S | $159,000 | None Available | |
| Barrows Michele R | -- | None Available |
Source: Public Records
Mortgage History
| Date | Status | Borrower | Loan Amount |
|---|---|---|---|
| Open | Farley Scott S | $154,969 | |
| Previous Owner | Barrows Michele R | $140,000 |
Source: Public Records
Tax History Compared to Growth
Tax History
| Year | Tax Paid | Tax Assessment Tax Assessment Total Assessment is a certain percentage of the fair market value that is determined by local assessors to be the total taxable value of land and additions on the property. | Land | Improvement |
|---|---|---|---|---|
| 2025 | $2,641 | $110,930 | $32,000 | $78,930 |
| 2024 | $2,615 | $110,930 | $32,000 | $78,930 |
| 2023 | $2,532 | $110,930 | $32,000 | $78,930 |
| 2022 | $2,441 | $110,350 | $32,000 | $78,350 |
| 2021 | $2,377 | $110,350 | $32,000 | $78,350 |
| 2020 | $2,377 | $110,350 | $32,000 | $78,350 |
| 2019 | $2,329 | $110,350 | $32,000 | $78,350 |
| 2018 | $2,280 | $110,350 | $32,000 | $78,350 |
| 2017 | $2,149 | $110,350 | $32,000 | $78,350 |
| 2016 | $2,072 | $110,350 | $32,000 | $78,350 |
| 2015 | $2,072 | $110,350 | $32,000 | $78,350 |
Source: Public Records
Map
Nearby Homes
- 41 Gregg Run Rd
- 11 Fetter Dr
- 158 S 4th St
- 172 S 4th St
- 312 Broadway St
- 00 Route 220 Hwy
- 147 S Main St
- 0 Route 220 Hwy
- 157 Red Barn Rd
- 1092 Beaver Lake Rd
- 424 Kahler Hills Dr Unit 16
- 40 Hunter Dr
- 297 Trinity Dr
- 122 Lime Bluff Rd
- 51 Chel Dr
- 961 Baker Hill Rd
- 2152 Clarkstown Rd
- 0 Mccoy Rd
- PARCEL 141 Mccoy Rd
- 0 Neufer Hollow Rd
- 601 Mcconnell Pkwy
- 551 Mcconnell Pkwy
- 102 Logan Ln
- 131 Logan Ln
- 53 Logan Ln
- 580 Mcconnell Pkwy
- 558 Mcconnell Pkwy
- 295 Brookfield Dr
- 160 Logan Ln
- 161 Logan Ln
- 648 Mcconnell Pkwy
- 525 Mcconnell Pkwy
- 685 Mcconnell Pkwy
- 213 Brookfield Dr
- 534 Mcconnell Pkwy
- 264 Aderhold Dr
- 294 Aderhold Dr
- 40 Logan Ln
- 187 Brookfield Dr
- 318 Aderhold Dr