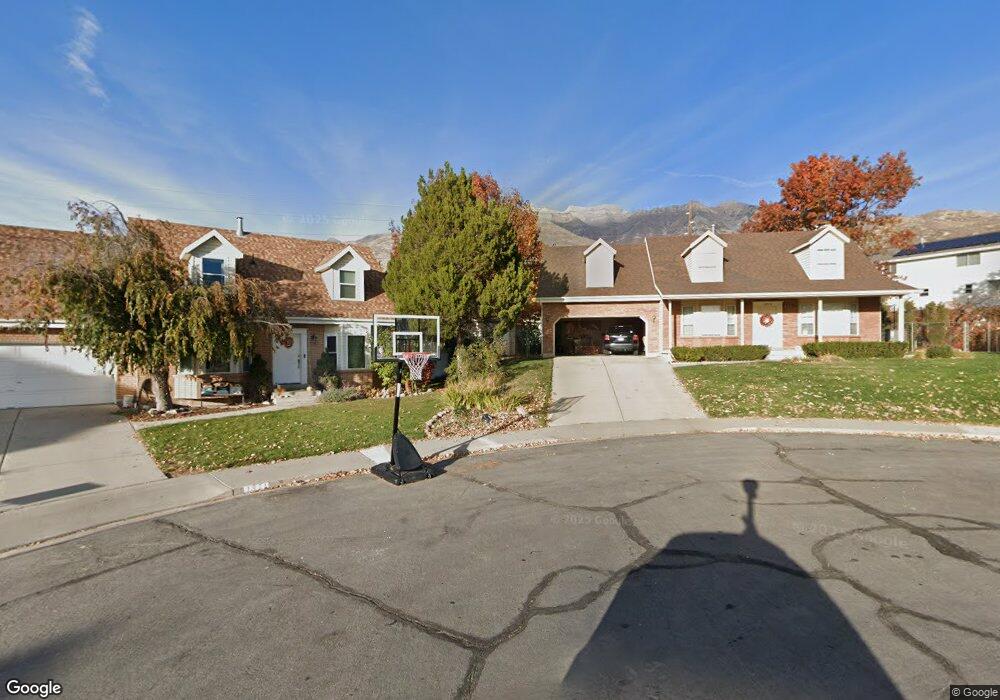
111 N 230 E Vineyard, UT 84057
Estimated Value: $862,000 - $1,222,000
3
Beds
3
Baths
4,248
Sq Ft
$240/Sq Ft
Est. Value
About This Home
This home is located at 111 N 230 E, Vineyard, UT 84057 and is currently estimated at $1,017,662, approximately $239 per square foot. 111 N 230 E is a home located in Utah County with nearby schools including Orem Junior High School, Mountain View High School, and Freedom Preparatory Academy - Vineyard.
Ownership History
Date
Name
Owned For
Owner Type
Purchase Details
Closed on
May 5, 2017
Sold by
Building Construction Partners Llc
Bought by
Newson Michael W and Newson Virginia W
Current Estimated Value
Home Financials for this Owner
Home Financials are based on the most recent Mortgage that was taken out on this home.
Original Mortgage
$424,000
Outstanding Balance
$353,858
Interest Rate
4.23%
Mortgage Type
New Conventional
Estimated Equity
$663,804
Create a Home Valuation Report for This Property
The Home Valuation Report is an in-depth analysis detailing your home's value as well as a comparison with similar homes in the area
Home Values in the Area
Average Home Value in this Area
Purchase History
| Date | Buyer | Sale Price | Title Company |
|---|---|---|---|
| Newson Michael W | -- | Select Title Ins Agency | |
| Building Constrnction Partners Llc | -- | Select Title Ins Agency |
Source: Public Records
Mortgage History
| Date | Status | Borrower | Loan Amount |
|---|---|---|---|
| Open | Newson Michael W | $424,000 |
Source: Public Records
Tax History
| Year | Tax Paid | Tax Assessment Tax Assessment Total Assessment is a certain percentage of the fair market value that is determined by local assessors to be the total taxable value of land and additions on the property. | Land | Improvement |
|---|---|---|---|---|
| 2025 | $4,624 | $477,180 | -- | -- |
| 2024 | $4,624 | $433,785 | $0 | $0 |
| 2023 | $3,726 | $390,500 | $0 | $0 |
| 2022 | $3,729 | $379,995 | $0 | $0 |
| 2021 | $3,223 | $503,400 | $182,600 | $320,800 |
| 2020 | $3,021 | $471,500 | $166,000 | $305,500 |
| 2019 | $2,830 | $455,100 | $159,000 | $296,100 |
| 2018 | $2,752 | $406,700 | $134,300 | $272,400 |
| 2017 | $1,420 | $113,100 | $0 | $0 |
Source: Public Records
Map
Nearby Homes
- 132 E Annual Way
- 20 W Stillwater S Unit 151
- 35 E Water Ln
- 65 E 425 N
- 271 N 110 W
- 422 E 360 North St
- 152 E 580 N
- 235 N 590 E
- 103 W 520 N
- 163 W Hackberry Rd Unit 6527
- 171 E 580 N
- 491 N Mallard Dr Unit C
- 579 N 290 E
- 212 N 590 E
- 78 N Scarlet Maple Dr Unit 4304
- 224 E 630 N
- 625 N Emery Ln
- 24 W Stillwater St S Unit 153
- 96 E 670 N
- 43 E 670 St N
Your Personal Tour Guide
Ask me questions while you tour the home.