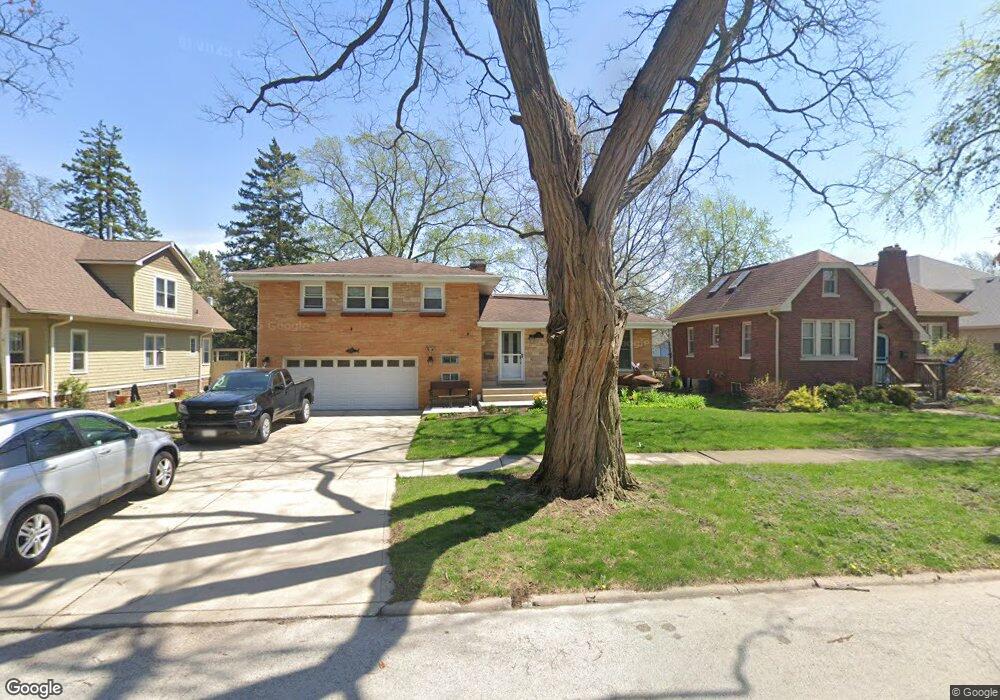
111 N Adams St Westmont, IL 60559
North Westmont NeighborhoodEstimated Value: $415,313 - $482,000
--
Bed
1
Bath
1,713
Sq Ft
$260/Sq Ft
Est. Value
About This Home
This home is located at 111 N Adams St, Westmont, IL 60559 and is currently estimated at $445,078, approximately $259 per square foot. 111 N Adams St is a home located in DuPage County with nearby schools including J T Manning Elementary School, C E Miller Elementary School, and Westmont Jr High School.
Ownership History
Date
Name
Owned For
Owner Type
Purchase Details
Closed on
Feb 26, 2004
Sold by
Sharkey Patrick B
Bought by
Sharkey Patrick B and Sharkey Laura A
Current Estimated Value
Home Financials for this Owner
Home Financials are based on the most recent Mortgage that was taken out on this home.
Original Mortgage
$174,000
Interest Rate
5.71%
Mortgage Type
New Conventional
Purchase Details
Closed on
Jun 25, 1998
Sold by
Hays Lisa C
Bought by
Sharkey Patrick B
Home Financials for this Owner
Home Financials are based on the most recent Mortgage that was taken out on this home.
Original Mortgage
$127,000
Interest Rate
7.03%
Purchase Details
Closed on
Mar 27, 1997
Sold by
Cech Anna M
Bought by
Sharkey Patrick B and Hays Lisa C
Home Financials for this Owner
Home Financials are based on the most recent Mortgage that was taken out on this home.
Original Mortgage
$125,400
Interest Rate
5.2%
Create a Home Valuation Report for This Property
The Home Valuation Report is an in-depth analysis detailing your home's value as well as a comparison with similar homes in the area
Home Values in the Area
Average Home Value in this Area
Purchase History
| Date | Buyer | Sale Price | Title Company |
|---|---|---|---|
| Sharkey Patrick B | -- | Ticor | |
| Sharkey Patrick B | -- | -- | |
| Sharkey Patrick B | $132,000 | -- |
Source: Public Records
Mortgage History
| Date | Status | Borrower | Loan Amount |
|---|---|---|---|
| Closed | Sharkey Patrick B | $174,000 | |
| Closed | Sharkey Patrick B | $127,000 | |
| Previous Owner | Sharkey Patrick B | $125,400 |
Source: Public Records
Tax History Compared to Growth
Tax History
| Year | Tax Paid | Tax Assessment Tax Assessment Total Assessment is a certain percentage of the fair market value that is determined by local assessors to be the total taxable value of land and additions on the property. | Land | Improvement |
|---|---|---|---|---|
| 2024 | $8,557 | $139,662 | $37,246 | $102,416 |
| 2023 | $8,080 | $128,390 | $34,240 | $94,150 |
| 2022 | $7,762 | $122,140 | $32,580 | $89,560 |
| 2021 | $7,459 | $120,750 | $32,210 | $88,540 |
| 2020 | $7,302 | $118,360 | $31,570 | $86,790 |
| 2019 | $7,050 | $113,570 | $30,290 | $83,280 |
| 2018 | $7,231 | $113,540 | $30,140 | $83,400 |
| 2017 | $7,036 | $109,250 | $29,000 | $80,250 |
| 2016 | $6,919 | $104,270 | $27,680 | $76,590 |
| 2015 | $6,801 | $98,100 | $26,040 | $72,060 |
| 2014 | $6,796 | $95,380 | $25,320 | $70,060 |
| 2013 | $7,513 | $110,320 | $25,160 | $85,160 |
Source: Public Records
Map
Nearby Homes
- 25 N Washington St
- 11 N Grant St
- 100 W Burlington Ave
- 124 W Naperville Rd
- 108 W Naperville Rd
- 260 N Linden Ave
- 226 N Wilmette Ave
- 242 N Wilmette Ave
- 206 S Adams St
- 114 E Richmond St
- 302 S Washington St
- 305 S Adams St
- 306 S Grant St
- 500 N Grant St
- 14 Mohawk Dr
- 4831 Florence Ave
- 315 S Park St
- 475 N Cass Ave Unit 212
- 4947 Wilcox Ave
- 5201 Florence Ave