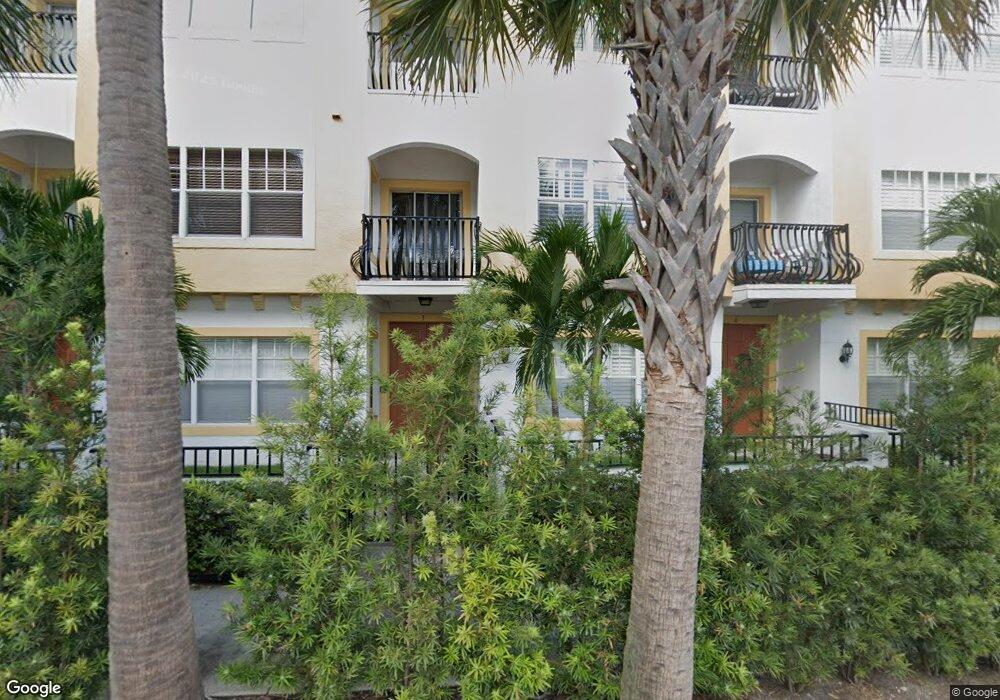
111 N Albany Ave Unit 13 Tampa, FL 33606
North Hyde Park NeighborhoodEstimated Value: $622,670 - $772,000
3
Beds
3
Baths
2,586
Sq Ft
$259/Sq Ft
Est. Value
About This Home
This home is located at 111 N Albany Ave Unit 13, Tampa, FL 33606 and is currently estimated at $669,918, approximately $259 per square foot. 111 N Albany Ave Unit 13 is a home located in Hillsborough County with nearby schools including Mitchell Elementary School, Wilson Middle School, and Plant High School.
Ownership History
Date
Name
Owned For
Owner Type
Purchase Details
Closed on
Sep 17, 2019
Sold by
Jenkins David E
Bought by
Jenkins David E
Current Estimated Value
Purchase Details
Closed on
Jun 4, 2010
Sold by
Edwards Douglas and Edwards Mary Ann
Bought by
Jenkins David E
Home Financials for this Owner
Home Financials are based on the most recent Mortgage that was taken out on this home.
Original Mortgage
$245,160
Outstanding Balance
$164,307
Interest Rate
4.97%
Mortgage Type
VA
Estimated Equity
$505,611
Purchase Details
Closed on
Nov 29, 2007
Sold by
North Hyde Park Cityhomes Llc
Bought by
Edwards Douglas and Edwards Mary Ann
Home Financials for this Owner
Home Financials are based on the most recent Mortgage that was taken out on this home.
Original Mortgage
$350,910
Interest Rate
6.29%
Mortgage Type
Unknown
Create a Home Valuation Report for This Property
The Home Valuation Report is an in-depth analysis detailing your home's value as well as a comparison with similar homes in the area
Home Values in the Area
Average Home Value in this Area
Purchase History
| Date | Buyer | Sale Price | Title Company |
|---|---|---|---|
| Jenkins David E | -- | Attorney | |
| Jenkins David E | $240,000 | Bay Title & Escrow Company | |
| Edwards Douglas | $389,900 | Westshore Title Group Llc |
Source: Public Records
Mortgage History
| Date | Status | Borrower | Loan Amount |
|---|---|---|---|
| Open | Jenkins David E | $245,160 | |
| Previous Owner | Edwards Douglas | $350,910 |
Source: Public Records
Tax History Compared to Growth
Tax History
| Year | Tax Paid | Tax Assessment Tax Assessment Total Assessment is a certain percentage of the fair market value that is determined by local assessors to be the total taxable value of land and additions on the property. | Land | Improvement |
|---|---|---|---|---|
| 2024 | $4,864 | $297,828 | -- | -- |
| 2023 | $4,735 | $289,153 | $0 | $0 |
| 2022 | $4,601 | $280,731 | $0 | $0 |
| 2021 | $4,539 | $272,554 | $0 | $0 |
| 2020 | $4,493 | $268,791 | $0 | $0 |
| 2019 | $4,408 | $262,748 | $0 | $0 |
| 2018 | $4,374 | $257,849 | $0 | $0 |
| 2017 | $4,307 | $326,591 | $0 | $0 |
| 2016 | $4,271 | $210,321 | $0 | $0 |
| 2015 | $2,828 | $174,904 | $0 | $0 |
| 2014 | $2,791 | $173,516 | $0 | $0 |
| 2013 | -- | $170,952 | $0 | $0 |
Source: Public Records
Map
Nearby Homes
- 111 N Albany Ave Unit 7
- 1919 W North A St
- 205 N Westland Ave
- 210 N Albany Ave Unit 2
- 111 S Melville Ave Unit 4
- 112 S Melville Ave Unit 2
- 1922 W Fig St Unit 1
- 1922 W Fig St Unit 2
- 116 S Fremont Ave Unit 3
- 109 S Packwood Ave Unit B
- 404 N Westland Ave Unit 1
- 406 N Westland Ave Unit 2
- 406 N Westland Ave Unit 1
- 104 S Moody Ave Unit 3
- 102 S Moody Ave Unit 3
- 2318 W North B St
- 1919 W Carmen St
- 2105 W Carmen St
- 2410 W North A St Unit 2
- 2407 W North B St Unit 2
- 111 N Albany Ave
- 111 N Albany Ave Unit 200
- 111 N Albany Ave Unit 15
- 111 N Albany Ave Unit 14
- 111 N Albany Ave Unit 16
- 111 N Albany Ave Unit 11
- 111 N Albany Ave Unit 5
- 111 N Albany Ave Unit 9
- 111 N Albany Ave Unit 12
- 111 N Albany Ave Unit 4
- 111 N Albany Ave Unit 2
- 111 N Albany Ave Unit 1
- 111 N Albany Ave Unit 8
- 111 N Albany Ave Unit 10
- 111 N Albany Ave Unit 6
- 111 N Albany Ave
- 108 N Albany Ave
- 108 N Albany Ave Unit 2
- 108 N Albany Ave Unit 1
- 110 N Albany Ave