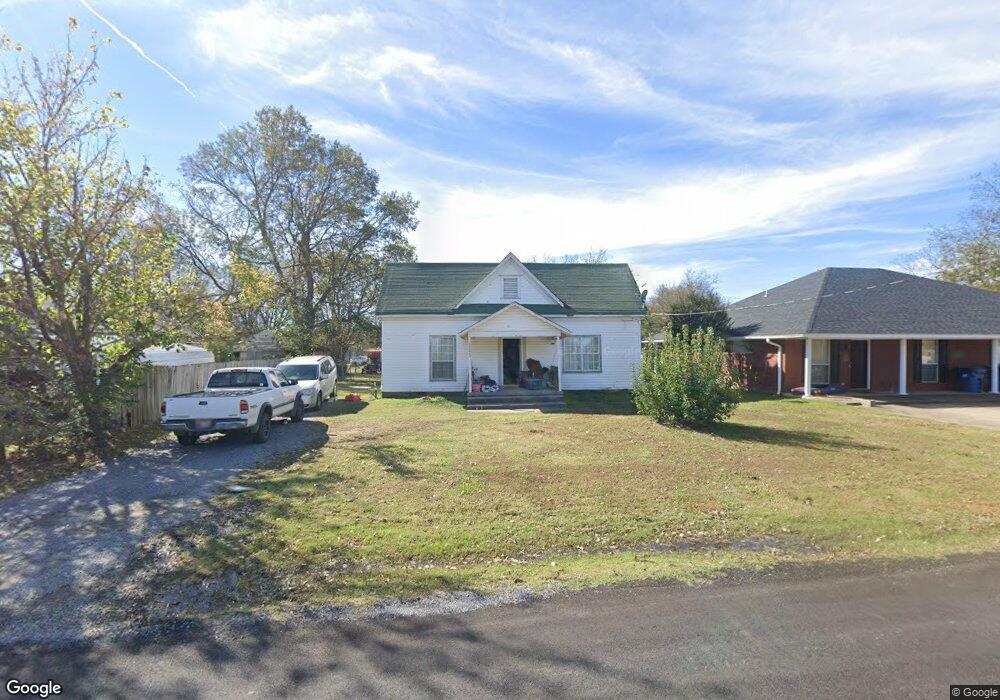
111 N Maple St McAlester, OK 74501
Estimated Value: $65,000 - $117,000
3
Beds
1
Bath
1,360
Sq Ft
$65/Sq Ft
Est. Value
About This Home
This home is located at 111 N Maple St, McAlester, OK 74501 and is currently estimated at $88,179, approximately $64 per square foot. 111 N Maple St is a home with nearby schools including Krebs Public School and Lakewood Christian School.
Ownership History
Date
Name
Owned For
Owner Type
Purchase Details
Closed on
Jan 3, 2017
Sold by
Cbb Inc
Bought by
Mahoney Brady and Mahoney Melanie
Current Estimated Value
Purchase Details
Closed on
Apr 26, 2011
Sold by
Davis James M
Bought by
American Southwest Mortgag Corp
Purchase Details
Closed on
Jun 5, 2009
Sold by
Peila Zachary P and Peila Kristin K
Bought by
Davis James M
Home Financials for this Owner
Home Financials are based on the most recent Mortgage that was taken out on this home.
Original Mortgage
$90,500
Interest Rate
4.84%
Mortgage Type
New Conventional
Purchase Details
Closed on
May 1, 2007
Sold by
Buck Lloyd B and Buck Rebecca L
Bought by
Peila Zachary P and Peila Kristin K
Home Financials for this Owner
Home Financials are based on the most recent Mortgage that was taken out on this home.
Original Mortgage
$66,025
Interest Rate
6.13%
Mortgage Type
New Conventional
Create a Home Valuation Report for This Property
The Home Valuation Report is an in-depth analysis detailing your home's value as well as a comparison with similar homes in the area
Home Values in the Area
Average Home Value in this Area
Purchase History
| Date | Buyer | Sale Price | Title Company |
|---|---|---|---|
| Mahoney Brady | $32,000 | None Available | |
| American Southwest Mortgag Corp | -- | None Available | |
| Davis James M | $87,000 | None Available | |
| Peila Zachary P | $69,500 | None Available |
Source: Public Records
Mortgage History
| Date | Status | Borrower | Loan Amount |
|---|---|---|---|
| Previous Owner | Davis James M | $90,500 | |
| Previous Owner | Peila Zachary P | $66,025 |
Source: Public Records
Tax History Compared to Growth
Tax History
| Year | Tax Paid | Tax Assessment Tax Assessment Total Assessment is a certain percentage of the fair market value that is determined by local assessors to be the total taxable value of land and additions on the property. | Land | Improvement |
|---|---|---|---|---|
| 2025 | $356 | $4,012 | $366 | $3,646 |
| 2024 | $356 | $4,207 | $366 | $3,841 |
| 2023 | $357 | $5,888 | $366 | $5,522 |
| 2022 | $494 | $5,713 | $366 | $5,347 |
| 2021 | $494 | $5,713 | $366 | $5,347 |
| 2020 | $446 | $5,182 | $366 | $4,816 |
| 2019 | $426 | $5,182 | $366 | $4,816 |
| 2018 | $405 | $4,701 | $366 | $4,335 |
| 2017 | $838 | $9,570 | $366 | $9,204 |
| 2016 | $844 | $9,570 | $366 | $9,204 |
| 2015 | $714 | $9,570 | $366 | $9,204 |
| 2014 | $714 | $9,570 | $366 | $9,204 |
Source: Public Records
Map
Nearby Homes
- 190 SW 2nd St
- 2082 Krebs Lake Rd
- 19 E Creek Ave
- 345 SW 4th St
- 525 SW 3rd St
- 516 Krebs Lake Rd
- 602 NW 8th St
- 0 Electric Unit 2548320
- 770 NW Seneca Ave
- 715 NW Bocci Dr
- 108 Stubbs Ln
- 0 N George Nigh Bypass Unit 2522698
- 498 Big Horn Rd
- 0 Liberty Cir Unit 2546556
- 4210 N Highway 69
- 0 17th St Unit 2549375
- 0 17th St Unit 2549259
- 1236 E Hereford Ln
- 2267 N Krebs Lake Rd
- 3601 E Hereford Ln
- 101 NE Maple St
- 125 N Maple St
- 55 W Maple St
- 102 NE Maple St
- 105 NW Church St
- 115 NW Church St
- 155 N Maple St
- 37 N Maple St
- 145 NW Church St
- 0 Jackson St Unit 1903840
- 0 Jackson St Unit 2001324
- 0 Jackson St Unit 2117777
- 70 NW Willow St
- 95 NW Church St
- 95 E Jackson Ave
- 65 NW Church St
- 60 NW Willow St
- 40 NW Fillmore Ave
- 580 NE Fillmore
- 125 NW Jackson Ave