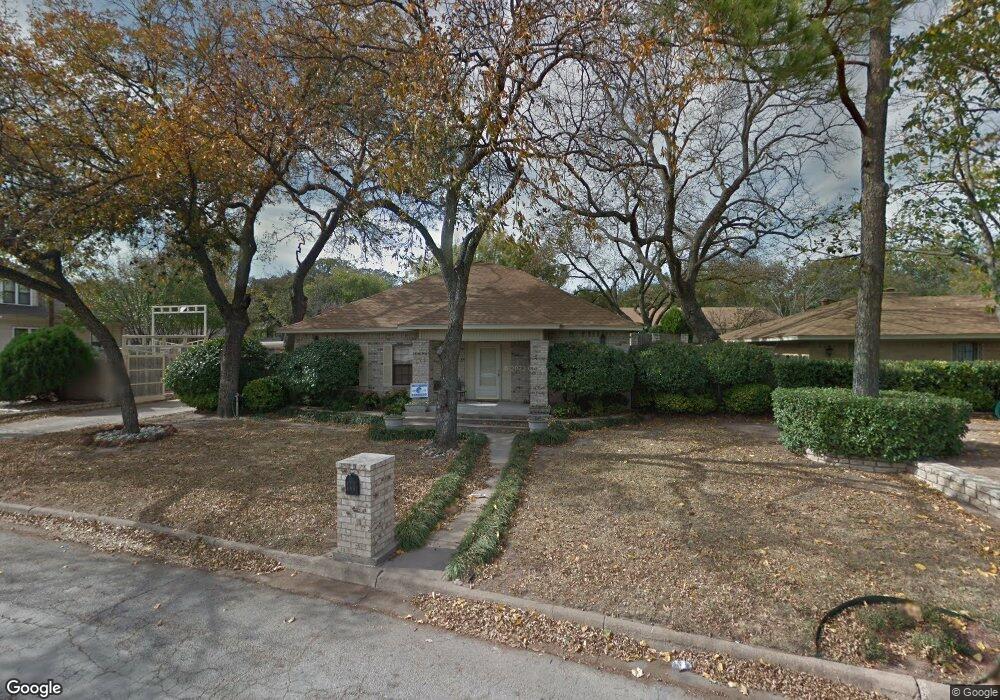
111 N Merrimac St Weatherford, TX 76086
Estimated Value: $303,384 - $406,000
--
Bed
--
Bath
2,226
Sq Ft
$159/Sq Ft
Est. Value
About This Home
This home is located at 111 N Merrimac St, Weatherford, TX 76086 and is currently estimated at $353,346, approximately $158 per square foot. 111 N Merrimac St is a home located in Parker County with nearby schools including Curtis Elementary School, Hall Middle School, and Weatherford High School.
Ownership History
Date
Name
Owned For
Owner Type
Purchase Details
Closed on
Aug 11, 2025
Sold by
Guest Richard Edward
Bought by
Guest Michael W
Current Estimated Value
Purchase Details
Closed on
Jul 27, 2002
Sold by
Guest Michael W
Bought by
Guest Michael W
Purchase Details
Closed on
Jan 1, 1901
Bought by
Guest Michael W
Create a Home Valuation Report for This Property
The Home Valuation Report is an in-depth analysis detailing your home's value as well as a comparison with similar homes in the area
Home Values in the Area
Average Home Value in this Area
Purchase History
| Date | Buyer | Sale Price | Title Company |
|---|---|---|---|
| Guest Michael W | -- | None Listed On Document | |
| Guest Michael W | -- | -- | |
| Guest Michael W | -- | -- |
Source: Public Records
Tax History Compared to Growth
Tax History
| Year | Tax Paid | Tax Assessment Tax Assessment Total Assessment is a certain percentage of the fair market value that is determined by local assessors to be the total taxable value of land and additions on the property. | Land | Improvement |
|---|---|---|---|---|
| 2025 | $4,226 | $300,298 | -- | -- |
| 2024 | $4,226 | $272,998 | -- | -- |
| 2023 | $4,226 | $248,180 | $0 | $0 |
| 2022 | $5,005 | $239,610 | $15,000 | $224,610 |
| 2021 | $4,926 | $239,610 | $15,000 | $224,610 |
| 2020 | $4,505 | $194,430 | $15,000 | $179,430 |
| 2019 | $4,329 | $194,430 | $15,000 | $179,430 |
| 2018 | $3,953 | $154,100 | $15,000 | $139,100 |
| 2017 | $4,055 | $154,100 | $15,000 | $139,100 |
| 2016 | $3,721 | $141,420 | $15,000 | $126,420 |
| 2015 | $3,644 | $141,420 | $15,000 | $126,420 |
| 2014 | $3,173 | $126,330 | $15,000 | $111,330 |
Source: Public Records
Map
Nearby Homes
- 702 W Spring St
- 606 Palo Pinto St
- 314 N Dubellette St
- 707 W Water St
- 313 N Dubellette St
- 1105 Palo Pinto St
- 516 W Spring St
- 905 W Oak St
- 514 W Spring St
- 1007 W Water St
- 220 S Merrimac
- 517 W Water St
- 616 W Baylor St
- 514 W Baylor St
- 510 N Boundary St
- 509 Bryan St
- 427 W Ball St
- 302 Case St
- 506 Chilton St
- 407 W Columbia St
- 113 N Merrimac St
- 105 N Merrimac St
- 106 N Merrimac St
- 805 W Spring St
- 116 N Merrimac St
- 806 Palo Pinto St
- 807 W Spring St
- 713 W Spring St
- 801 W Spring St
- 813 W Spring St
- 709 W Spring St
- 0 Palo Pinto St
- 704 Palo Pinto St
- 802 W Spring St
- 705 W Spring St
- 903 W Spring St
- 714 W Spring St
- 806 W Spring St
- 901 W Spring St
- 810 W Spring St