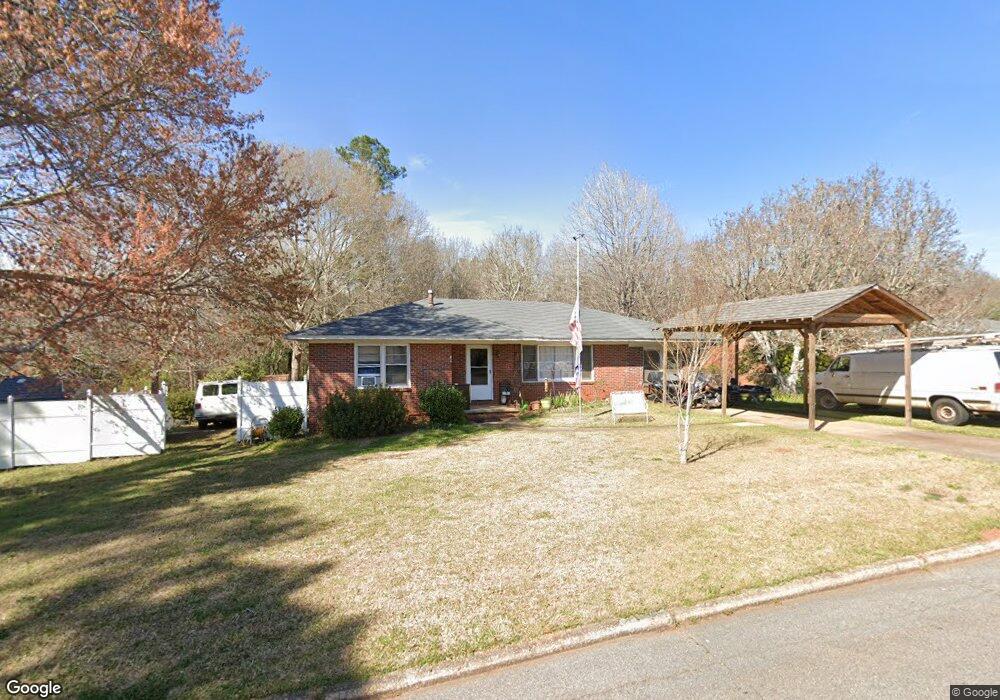
111 N Page St Lagrange, GA 30241
Estimated Value: $165,000 - $201,000
3
Beds
1
Bath
1,560
Sq Ft
$122/Sq Ft
Est. Value
About This Home
This home is located at 111 N Page St, Lagrange, GA 30241 and is currently estimated at $189,740, approximately $121 per square foot. 111 N Page St is a home located in Troup County with nearby schools including Franklin Forest Elementary School, Hollis Hand Elementary School, and Hillcrest Elementary School.
Ownership History
Date
Name
Owned For
Owner Type
Purchase Details
Closed on
Jun 29, 1998
Sold by
Mize John W and Mize Sharon A
Bought by
Harper Albert L and Harper Theresa
Current Estimated Value
Purchase Details
Closed on
Oct 5, 1990
Sold by
Smith T C
Bought by
Mize John W and Mize Sharon A
Purchase Details
Closed on
Oct 4, 1990
Bought by
Smith T C
Purchase Details
Closed on
Jan 1, 1961
Sold by
Datson Cook
Create a Home Valuation Report for This Property
The Home Valuation Report is an in-depth analysis detailing your home's value as well as a comparison with similar homes in the area
Purchase History
| Date | Buyer | Sale Price | Title Company |
|---|---|---|---|
| Harper Albert L | $74,800 | -- | |
| Mize John W | $43,000 | -- | |
| Smith T C | -- | -- | |
| -- | -- | -- |
Source: Public Records
Tax History
| Year | Tax Paid | Tax Assessment Tax Assessment Total Assessment is a certain percentage of the fair market value that is determined by local assessors to be the total taxable value of land and additions on the property. | Land | Improvement |
|---|---|---|---|---|
| 2025 | $1,407 | $56,524 | $10,000 | $46,524 |
| 2024 | $1,260 | $48,204 | $10,000 | $38,204 |
| 2023 | $1,110 | $42,684 | $10,000 | $32,684 |
| 2022 | $1,093 | $41,164 | $10,000 | $31,164 |
| 2021 | $1,013 | $35,584 | $8,000 | $27,584 |
| 2020 | $1,013 | $35,584 | $8,000 | $27,584 |
| 2019 | $836 | $29,708 | $4,400 | $25,308 |
| 2018 | $836 | $29,708 | $4,400 | $25,308 |
| 2017 | $836 | $29,708 | $4,400 | $25,308 |
| 2016 | $837 | $29,752 | $4,400 | $25,352 |
| 2015 | $727 | $26,044 | $4,527 | $21,518 |
| 2014 | $694 | $24,912 | $4,527 | $20,385 |
| 2013 | -- | $26,719 | $4,527 | $22,192 |
Source: Public Records
Map
Nearby Homes
- 134 S Page St
- 114 Briarcliff Rd
- 806 New Franklin Rd
- 204 Dixie Creek Dr
- 102 Beech Creek Dr
- 204 Colonial St
- 110 Russell St
- 519 Tradition Place
- 517 Tradition Place
- 900 North St
- 129 Celebration Blvd
- 732 Camellia Dr
- 106 Ewing St
- 202 Park Hill Dr
- 200 Crestwood Dr
- 724 Camellia Dr
- 102 Dogwood Dr
- 112 Celebration Blvd
- 201 S Chilton Crescent
- 203 S Chilton Crescent
- 115 N Page St
- 108 N Page St
- 117 N Page St
- 116 N Page St
- 114 N Page St
- 121 N Page St
- 118 N Page St
- 912 New Franklin Rd
- 120 N Page St
- 119 S Page St
- 916 New Franklin Rd
- 115 S Page St
- 123 N Page St
- 127 S Page St
- 111 S Page St Unit 1
- 111 S Page St
- 122 N Page St
- 131 S Page St
- 101 S Page St
- 902 New Franklin Rd
Your Personal Tour Guide
Ask me questions while you tour the home.