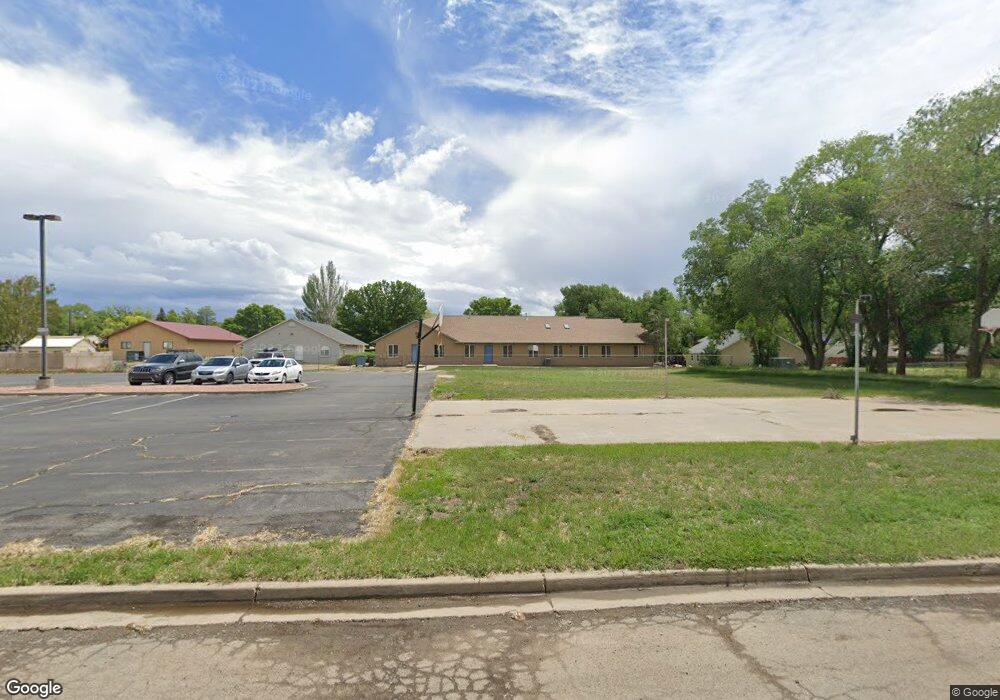
111 N Park St Cortez, CO 81321
Estimated Value: $842,280
--
Bed
2
Baths
2,637
Sq Ft
$319/Sq Ft
Est. Value
About This Home
This home is located at 111 N Park St, Cortez, CO 81321 and is currently estimated at $842,280, approximately $319 per square foot. 111 N Park St is a home located in Montezuma County with nearby schools including Montezuma-Cortez High School, Children's Kiva Montessori School, and Southwest Open Charter School.
Ownership History
Date
Name
Owned For
Owner Type
Purchase Details
Closed on
Dec 1, 2023
Sold by
B & K Demby Trust Llc
Bought by
Lone Fox Llc
Current Estimated Value
Home Financials for this Owner
Home Financials are based on the most recent Mortgage that was taken out on this home.
Original Mortgage
$328,000
Outstanding Balance
$322,690
Interest Rate
7.63%
Estimated Equity
$519,590
Purchase Details
Closed on
Feb 13, 2003
Sold by
B & K Demby Trust Llc
Bought by
B & K Demby Trust Llc
Purchase Details
Closed on
Apr 9, 2002
Sold by
Demby Brian D and Demby Karla J
Bought by
B & K Demby Trust Llc
Purchase Details
Closed on
Feb 10, 2000
Sold by
Johnson Dirk E and Johnson Barbar
Bought by
Demby Brian D and Demby Karla J
Purchase Details
Closed on
Aug 12, 1999
Sold by
Ragland & Sons Logging I
Bought by
Johnson Dirk E and Johnson Barbara A
Purchase Details
Closed on
Apr 6, 1988
Sold by
Biard Ronald L
Bought by
Ragland & Sons Logging Inc
Create a Home Valuation Report for This Property
The Home Valuation Report is an in-depth analysis detailing your home's value as well as a comparison with similar homes in the area
Home Values in the Area
Average Home Value in this Area
Purchase History
| Date | Buyer | Sale Price | Title Company |
|---|---|---|---|
| Lone Fox Llc | -- | None Listed On Document | |
| B & K Demby Trust Llc | -- | -- | |
| B & K Demby Trust Llc | -- | -- | |
| Demby Brian D | $85,500 | -- | |
| Johnson Dirk E | $103,500 | -- | |
| Ragland & Sons Logging Inc | $41,400 | -- |
Source: Public Records
Mortgage History
| Date | Status | Borrower | Loan Amount |
|---|---|---|---|
| Open | Lone Fox Llc | $328,000 | |
| Closed | Lone Fox Llc | $410,000 |
Source: Public Records
Tax History Compared to Growth
Tax History
| Year | Tax Paid | Tax Assessment Tax Assessment Total Assessment is a certain percentage of the fair market value that is determined by local assessors to be the total taxable value of land and additions on the property. | Land | Improvement |
|---|---|---|---|---|
| 2024 | $13,980 | $238,089 | $47,566 | $190,523 |
| 2023 | $13,193 | $246,789 | $47,566 | $199,223 |
| 2022 | $10,697 | $193,134 | $29,445 | $163,689 |
| 2021 | $10,575 | $193,134 | $29,445 | $163,689 |
| 2020 | $10,629 | $201,601 | $29,445 | $172,156 |
| 2019 | $10,655 | $201,601 | $29,445 | $172,156 |
| 2018 | $12,606 | $197,770 | $29,450 | $168,320 |
| 2017 | $12,543 | $197,770 | $29,450 | $168,320 |
| 2016 | $11,358 | $197,710 | $29,450 | $168,260 |
| 2015 | $10,426 | $1,077,170 | $0 | $0 |
| 2014 | $12,140 | $197,710 | $0 | $0 |
Source: Public Records
Map
Nearby Homes
- 787 Aspen Dr
- 791 Birch Dr
- 217 S Valley Rd
- 145 S Madison St
- 219 E Montezuma Ave
- 323 N Washington St
- 201 S Washington St
- 418 S Valley Rd
- 219 Edith St
- 2245 S Park Dr
- 625 N Harrison St
- 506 Amanda Lee Ln
- 505 S Valley Rd
- 102 E Montezuma Ave
- 506 & 506 1/2 N Ash St
- TBD E Empire St
- 23 E Montezuma Ave
- 1002 E Carpenter St
- 144 S Market St
- TBD E Driscoll St
- 0 Park St Unit 744046
- 0 Park St Unit 738632
- 15 N Park St
- 11 N Park St
- 9 N Park St
- 714 E Montezuma Ave
- 201 N Park St
- 710 E Montezuma Ave
- 706 E Montezuma Ave
- 702 E Montezuma Ave
- 102 N Adams St
- 116 N Adams St
- N Adams St
- 112 N Adams St
- 720 E Main St
- 205 N Park St
- 0 Aspen
- 791 Aspen Dr
- 783 Aspen Dr
- 539 E Montezuma Ave