Estimated Value: $271,667 - $296,000
3
Beds
2
Baths
1,276
Sq Ft
$224/Sq Ft
Est. Value
About This Home
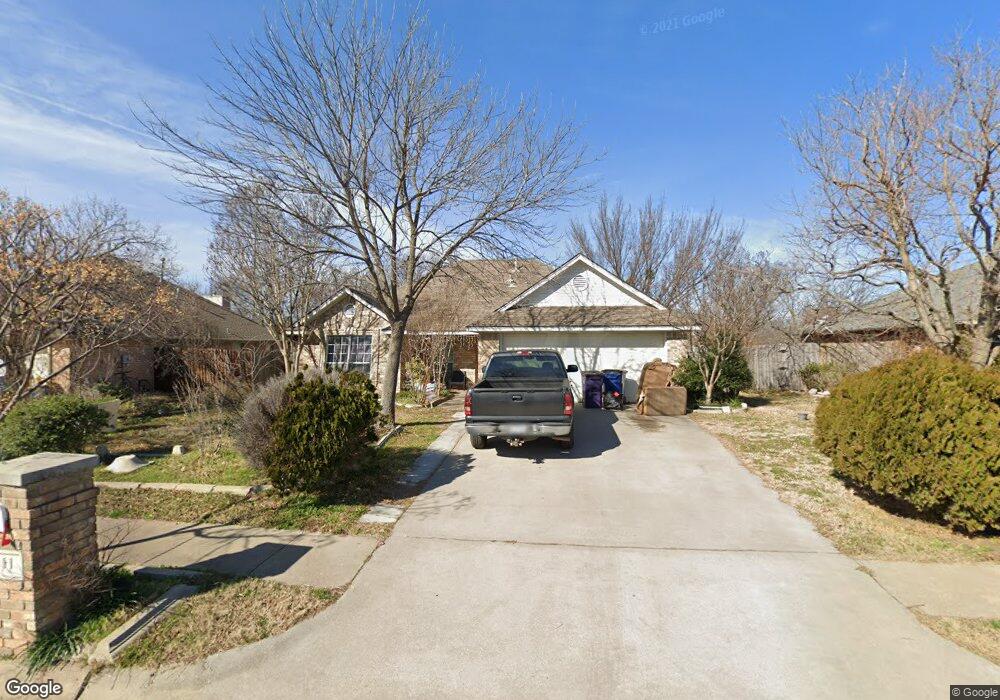
This home is located at 111 N Point Dr, Krum, TX 76249 and is currently estimated at $285,917, approximately $224 per square foot. 111 N Point Dr is a home located in Denton County with nearby schools including Krum Early Education Center, Blanche Dodd Intermediate School, and Krum Middle School.
Ownership History
Date
Name
Owned For
Owner Type
Purchase Details
Closed on
Apr 23, 2018
Sold by
Pena Ruben and Pena Antonia
Bought by
Koliba Elizabeth
Current Estimated Value
Home Financials for this Owner
Home Financials are based on the most recent Mortgage that was taken out on this home.
Original Mortgage
$175,570
Outstanding Balance
$150,663
Interest Rate
4.44%
Mortgage Type
New Conventional
Estimated Equity
$135,254
Purchase Details
Closed on
Dec 22, 2000
Sold by
David Manning Inc
Bought by
Pena Ruben and Pena Antonia
Home Financials for this Owner
Home Financials are based on the most recent Mortgage that was taken out on this home.
Original Mortgage
$93,605
Interest Rate
7.63%
Purchase Details
Closed on
Jan 18, 2000
Sold by
Edmonds Investments Inc
Bought by
David Manning Inc
Home Financials for this Owner
Home Financials are based on the most recent Mortgage that was taken out on this home.
Original Mortgage
$77,600
Interest Rate
7.86%
Mortgage Type
Purchase Money Mortgage
Create a Home Valuation Report for This Property
The Home Valuation Report is an in-depth analysis detailing your home's value as well as a comparison with similar homes in the area
Home Values in the Area
Average Home Value in this Area
Purchase History
| Date | Buyer | Sale Price | Title Company |
|---|---|---|---|
| Koliba Elizabeth | -- | None Available | |
| Pena Ruben | -- | -- | |
| Pena Ruben | -- | -- | |
| David Manning Inc | -- | -- | |
| David Manning Inc | -- | -- |
Source: Public Records
Mortgage History
| Date | Status | Borrower | Loan Amount |
|---|---|---|---|
| Open | Koliba Elizabeth | $175,570 | |
| Previous Owner | Pena Ruben | $93,605 | |
| Previous Owner | David Manning Inc | $77,600 |
Source: Public Records
Tax History
| Year | Tax Paid | Tax Assessment Tax Assessment Total Assessment is a certain percentage of the fair market value that is determined by local assessors to be the total taxable value of land and additions on the property. | Land | Improvement |
|---|---|---|---|---|
| 2025 | $5,554 | $276,350 | $55,624 | $220,726 |
| 2024 | $5,554 | $275,589 | $55,624 | $219,965 |
| 2023 | $5,582 | $276,446 | $55,624 | $220,822 |
| 2022 | $5,359 | $233,645 | $55,624 | $178,021 |
| 2021 | $4,433 | $199,903 | $41,505 | $158,398 |
| 2020 | $4,371 | $193,015 | $41,504 | $151,511 |
| 2019 | $4,368 | $181,000 | $41,505 | $139,495 |
| 2018 | $3,602 | $148,500 | $34,230 | $122,727 |
| 2017 | $3,288 | $135,000 | $24,218 | $110,782 |
| 2016 | $2,889 | $124,694 | $24,218 | $112,794 |
| 2015 | $2,438 | $113,358 | $24,218 | $89,140 |
| 2014 | $2,438 | $108,495 | $24,218 | $84,277 |
| 2013 | -- | $103,237 | $24,218 | $79,019 |
Source: Public Records
Map
Nearby Homes
- 220 Brook Cir
- 209 Mourning Dove Ln
- 7257 Christina Ct
- 7272 Christina Ct
- 2 Finley Cir
- 4 Finley Cir
- 503 N 2nd St
- 107 N 7th St
- 201 N 3rd St
- 101 N 7th St
- 124 Fm 2450
- 420 Woodlawn St
- 125 W 5th St
- TBD Hopkins Rd
- 102 Clearman St
- 438 South St
- 331 Osage Ct
- 418 S 2nd St
- 3425 Eloise Ln
- 0 Farm To Market Road 1173
- 109 N Point Dr
- 113 N Point Dr
- 107 N Point Dr
- 115 N Point Dr
- 218 Dove Meadows
- 215 Mourning Dove Ln
- 105 N Point Dr
- 216 Dove Meadows
- 117 N Point Dr
- 213 Mourning Dove Ln
- 221 Dove Meadows
- 214 Dove Meadows
- 103 N Point Dr
- 219 Dove Meadows
- 119 N Point Dr
- 212 Mourning Dove Ln
- 217 Dove Meadows
- 212 Dove Meadows
- 211 Mourning Dove Ln
- 101 N Point Dr
Your Personal Tour Guide
Ask me questions while you tour the home.