Estimated Value: $294,215 - $330,000
4
Beds
2
Baths
2,085
Sq Ft
$151/Sq Ft
Est. Value
About This Home
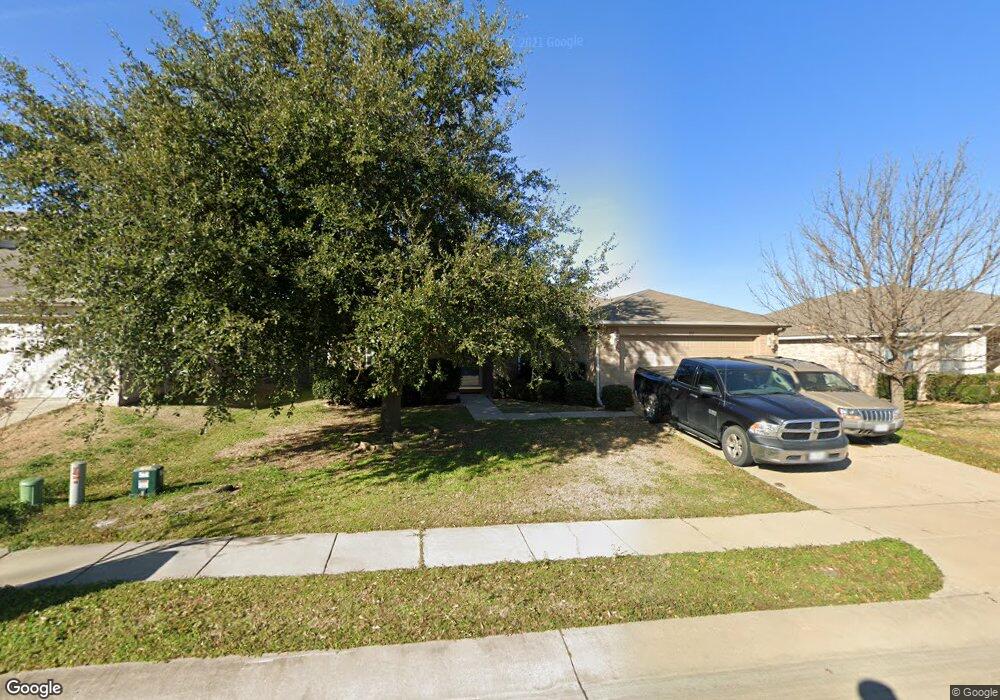
This home is located at 111 Nighthawk Dr, Krum, TX 76249 and is currently estimated at $315,304, approximately $151 per square foot. 111 Nighthawk Dr is a home located in Denton County with nearby schools including Krum Early Education Center, Blanche Dodd Intermediate School, and Krum Middle School.
Ownership History
Date
Name
Owned For
Owner Type
Purchase Details
Closed on
Jun 22, 2012
Sold by
Hyman Jerrie
Bought by
Evans R Scott R and Evans Lynn Dale
Current Estimated Value
Home Financials for this Owner
Home Financials are based on the most recent Mortgage that was taken out on this home.
Original Mortgage
$62,000
Outstanding Balance
$42,755
Interest Rate
3.8%
Mortgage Type
New Conventional
Estimated Equity
$272,549
Purchase Details
Closed on
Jun 19, 2006
Sold by
Mendoza Ricky Lee and Mendoza Delores
Bought by
Hyman Jerrie
Home Financials for this Owner
Home Financials are based on the most recent Mortgage that was taken out on this home.
Original Mortgage
$20,550
Interest Rate
6.58%
Mortgage Type
Stand Alone Second
Purchase Details
Closed on
Mar 1, 2003
Sold by
Rh Of Texas Lp
Bought by
Mendoza Ricky Lee
Home Financials for this Owner
Home Financials are based on the most recent Mortgage that was taken out on this home.
Original Mortgage
$141,034
Interest Rate
5.86%
Mortgage Type
FHA
Create a Home Valuation Report for This Property
The Home Valuation Report is an in-depth analysis detailing your home's value as well as a comparison with similar homes in the area
Home Values in the Area
Average Home Value in this Area
Purchase History
| Date | Buyer | Sale Price | Title Company |
|---|---|---|---|
| Evans R Scott R | -- | Freedom Title | |
| Hyman Jerrie | -- | None Available | |
| Mendoza Ricky Lee | -- | -- |
Source: Public Records
Mortgage History
| Date | Status | Borrower | Loan Amount |
|---|---|---|---|
| Open | Evans R Scott R | $62,000 | |
| Previous Owner | Hyman Jerrie | $20,550 | |
| Previous Owner | Hyman Jerrie | $109,600 | |
| Previous Owner | Mendoza Ricky Lee | $141,034 |
Source: Public Records
Tax History
| Year | Tax Paid | Tax Assessment Tax Assessment Total Assessment is a certain percentage of the fair market value that is determined by local assessors to be the total taxable value of land and additions on the property. | Land | Improvement |
|---|---|---|---|---|
| 2025 | $6,300 | $292,684 | $67,860 | $224,824 |
| 2024 | $6,300 | $312,607 | $67,860 | $244,747 |
| 2023 | $6,736 | $333,605 | $67,860 | $265,745 |
| 2022 | $6,184 | $269,610 | $67,860 | $201,750 |
| 2021 | $5,109 | $230,375 | $49,010 | $181,365 |
| 2020 | $4,784 | $211,257 | $40,716 | $170,541 |
| 2019 | $5,110 | $211,777 | $40,716 | $171,061 |
| 2018 | $4,642 | $191,395 | $40,716 | $150,679 |
| 2017 | $4,429 | $181,832 | $40,716 | $141,116 |
| 2016 | $4,410 | $171,645 | $24,882 | $146,763 |
| 2015 | $3,424 | $152,020 | $24,882 | $127,138 |
| 2014 | $3,424 | $139,197 | $24,882 | $114,315 |
| 2013 | -- | $137,301 | $24,882 | $112,419 |
Source: Public Records
Map
Nearby Homes
- 0 Farm To Market Road 1173
- 3207 Camden Creek Rd
- 105 Thoroughbred Dr
- 101 Thoroughbred Dr
- 1606 Withers Way
- 3425 Eloise Ln
- 334 Saddlebrook Dr
- 905 Clearview St
- TBD Masch Branch Rd
- 3725 Ranchers Ridge
- 3724 Ranchers Ridge
- 107 N 7th St
- 101 N 7th St
- 300 E 6th St
- 7272 Christina Ct
- 7257 Christina Ct
- 5266 Meadow Ln
- 213 Dove Meadows
- 220 Brook Cir
- 5254 Crystal Lake Ave
- 109 Nighthawk Dr
- 113 Nighthawk Dr
- 1310 Dakota Trail
- 107 Nighthawk Dr
- 112 Nighthawk Dr
- 1309 Sequoia Dr
- 1316 Dakota Trail
- 114 Nighthawk Dr
- 1307 Sequoia Dr
- 1311 Sequoia Dr
- 116 Nighthawk Dr
- 1320 Dakota Trail
- 118 Nighthawk Dr
- 1324 Dakota Trail
- 106 Nighthawk Dr
- 111 Comanche Trail
- 1309 Dakota Trail
- 113 Comanche Trail
- 1311 Dakota Trail
- 109 Comanche Trail
Your Personal Tour Guide
Ask me questions while you tour the home.