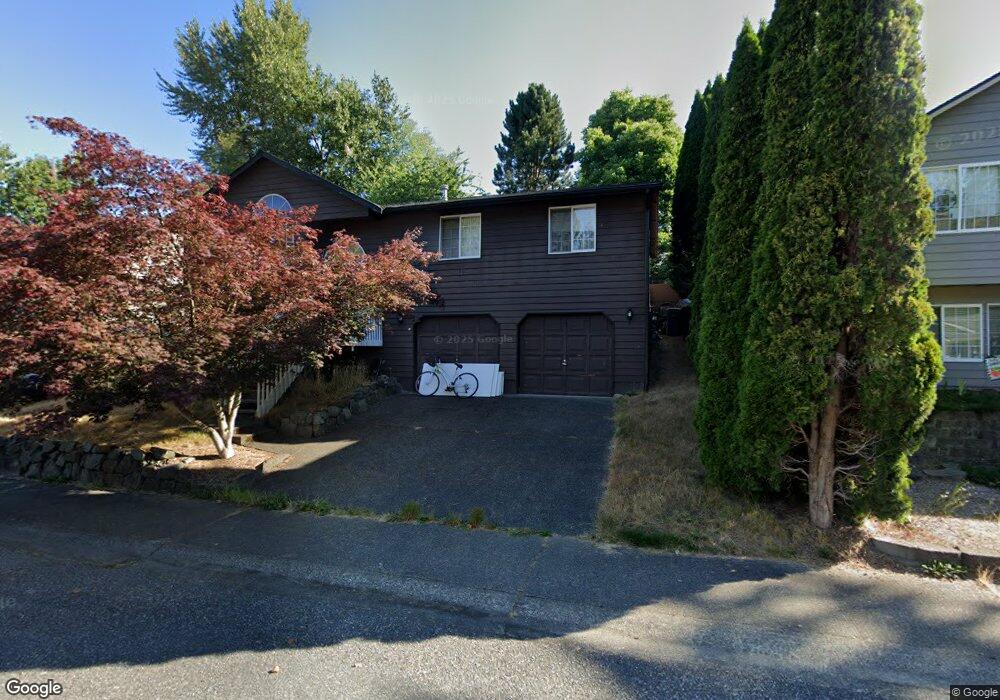
111 Noble Way Granite Falls, WA 98252
Estimated Value: $537,000 - $568,000
3
Beds
2
Baths
1,811
Sq Ft
$306/Sq Ft
Est. Value
About This Home
This home is located at 111 Noble Way, Granite Falls, WA 98252 and is currently estimated at $554,566, approximately $306 per square foot. 111 Noble Way is a home located in Snohomish County with nearby schools including Mountain Way Elementary School, Granite Falls Middle School, and Granite Falls High School.
Ownership History
Date
Name
Owned For
Owner Type
Purchase Details
Closed on
Nov 12, 2004
Sold by
Vaughn Cynthia D
Bought by
Thoreson Justin D and Thoreson Dawn R
Current Estimated Value
Home Financials for this Owner
Home Financials are based on the most recent Mortgage that was taken out on this home.
Original Mortgage
$215,380
Outstanding Balance
$107,553
Interest Rate
5.79%
Mortgage Type
VA
Estimated Equity
$447,013
Purchase Details
Closed on
Sep 26, 2003
Sold by
Vaughn Martin J
Bought by
Vaughn Cynthia D
Purchase Details
Closed on
Feb 20, 1997
Sold by
Granite Ridge Investors Lp
Bought by
Vaughn Martin J and Vaughn Cynthia D
Home Financials for this Owner
Home Financials are based on the most recent Mortgage that was taken out on this home.
Original Mortgage
$137,700
Interest Rate
7.86%
Mortgage Type
VA
Create a Home Valuation Report for This Property
The Home Valuation Report is an in-depth analysis detailing your home's value as well as a comparison with similar homes in the area
Home Values in the Area
Average Home Value in this Area
Purchase History
| Date | Buyer | Sale Price | Title Company |
|---|---|---|---|
| Thoreson Justin D | $208,500 | First American Title Ins Co | |
| Vaughn Cynthia D | -- | -- | |
| Vaughn Martin J | $135,000 | -- |
Source: Public Records
Mortgage History
| Date | Status | Borrower | Loan Amount |
|---|---|---|---|
| Open | Thoreson Justin D | $215,380 | |
| Previous Owner | Vaughn Martin J | $137,700 |
Source: Public Records
Tax History Compared to Growth
Tax History
| Year | Tax Paid | Tax Assessment Tax Assessment Total Assessment is a certain percentage of the fair market value that is determined by local assessors to be the total taxable value of land and additions on the property. | Land | Improvement |
|---|---|---|---|---|
| 2025 | $4,030 | $518,800 | $215,700 | $303,100 |
| 2024 | $4,030 | $453,600 | $178,600 | $275,000 |
| 2023 | $4,105 | $496,500 | $211,900 | $284,600 |
| 2022 | $3,808 | $374,300 | $146,300 | $228,000 |
| 2020 | $3,776 | $313,100 | $113,100 | $200,000 |
| 2019 | $3,351 | $292,900 | $108,300 | $184,600 |
| 2018 | $3,448 | $257,600 | $84,600 | $173,000 |
| 2017 | $3,023 | $227,000 | $64,000 | $163,000 |
| 2016 | $2,942 | $210,300 | $53,900 | $156,400 |
| 2015 | $2,693 | $187,400 | $46,100 | $141,300 |
| 2013 | $2,293 | $145,300 | $40,200 | $105,100 |
Source: Public Records
Map
Nearby Homes
- 114 Tompkins Place
- 115 Tompkins Place
- 307 Portage Ave
- 201 W Stanley St
- 901 W Stanley St
- 204 W Stanley St
- 202 W Grand St
- 9402 Ray Gray Rd Unit A
- 177 XXX Crooked Mile Rd
- 201 S Kentucky Ave
- 8824 184th Ave NE
- 0 8XXX Washington 92
- 419 Penny Ave
- 307 Vista Ct
- 222 Raybird Ave
- 225 Paradise Pkwy
- 420 Raybird Ave
- 17916 Maple St
- 17704 Maple St
- 17803 Mill Valley Rd
- 113 Noble Way
- 109 Noble Way
- 108 Tompkins Place
- 110 Tompkins Place
- 115 Noble Way
- 100 Tompkins Place
- 117 Noble Way
- 114 Noble Way
- 112 Noble Way
- 116 Tompkins Place
- 116 Noble Way
- 110 Noble Way
- 118 Noble Way
- 118 Tompkins Place
- 105 Tompkins Place
- 108 Noble Way
- 101 Tompkins Place
- 109 Tompkins Place
- 103 Tompkins Place