Estimated Value: $291,000 - $309,000
3
Beds
2
Baths
1,504
Sq Ft
$200/Sq Ft
Est. Value
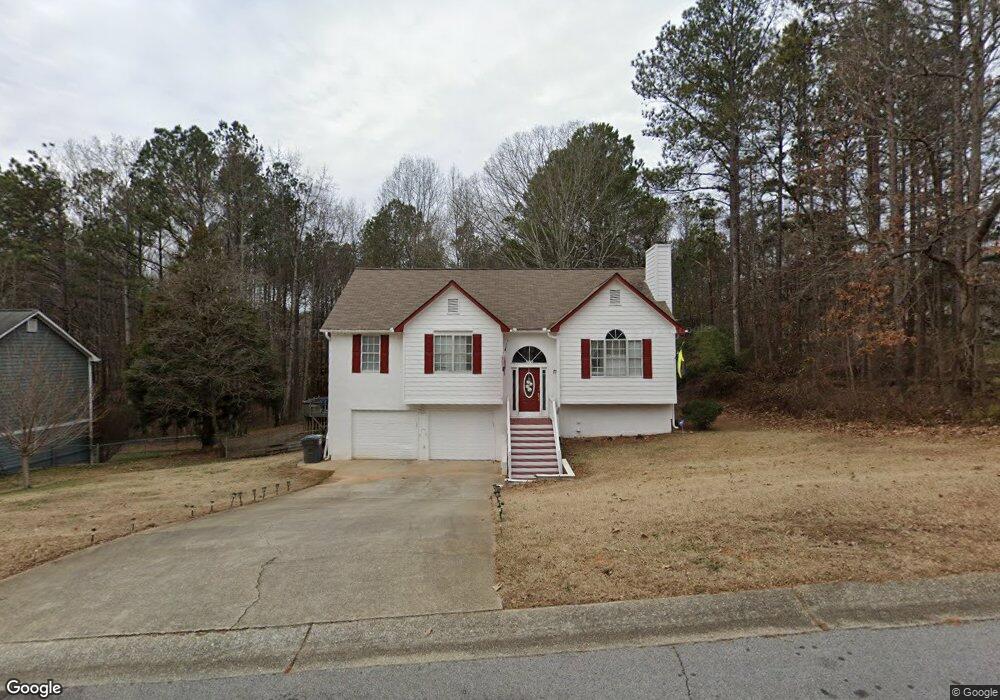
About This Home
This home is located at 111 Olde Mill Pointe Unit PT, Hiram, GA 30141 and is currently estimated at $300,503, approximately $199 per square foot. 111 Olde Mill Pointe Unit PT is a home located in Paulding County with nearby schools including Sam D. Panter Elementary School, J. A. Dobbins Middle School, and Paulding County High School.
Ownership History
Date
Name
Owned For
Owner Type
Purchase Details
Closed on
Apr 29, 2021
Sold by
Francis Hixford
Bought by
Francis Hixford and Francis Gwen
Current Estimated Value
Purchase Details
Closed on
Nov 14, 2016
Sold by
Michael L
Bought by
Francis Hixford and Francis Inez
Home Financials for this Owner
Home Financials are based on the most recent Mortgage that was taken out on this home.
Original Mortgage
$129,934
Interest Rate
3.5%
Mortgage Type
FHA
Purchase Details
Closed on
Dec 26, 2001
Sold by
Smith Tracy L and Alvord Michael
Bought by
Alvord Tracy L
Purchase Details
Closed on
Oct 11, 1993
Sold by
Jade Developers Inc
Purchase Details
Closed on
Jan 30, 1993
Sold by
Dobbins Terry
Purchase Details
Closed on
Jan 29, 1993
Sold by
Dobbins Terry Inc
Create a Home Valuation Report for This Property
The Home Valuation Report is an in-depth analysis detailing your home's value as well as a comparison with similar homes in the area
Home Values in the Area
Average Home Value in this Area
Purchase History
| Date | Buyer | Sale Price | Title Company |
|---|---|---|---|
| Francis Hixford | -- | -- | |
| Francis Hixford | $139,700 | -- | |
| Alvord Tracy L | -- | -- | |
| -- | $88,900 | -- | |
| -- | $8,000 | -- | |
| -- | $11,800 | -- |
Source: Public Records
Mortgage History
| Date | Status | Borrower | Loan Amount |
|---|---|---|---|
| Previous Owner | Francis Hixford | $129,934 |
Source: Public Records
Tax History
| Year | Tax Paid | Tax Assessment Tax Assessment Total Assessment is a certain percentage of the fair market value that is determined by local assessors to be the total taxable value of land and additions on the property. | Land | Improvement |
|---|---|---|---|---|
| 2025 | $744 | $122,960 | $12,000 | $110,960 |
| 2024 | $736 | $110,756 | $12,000 | $98,756 |
| 2023 | $877 | $111,416 | $12,000 | $99,416 |
| 2022 | $2,935 | $98,816 | $12,000 | $86,816 |
| 2021 | $2,090 | $70,360 | $8,000 | $62,360 |
| 2020 | $1,905 | $64,136 | $8,000 | $56,136 |
| 2019 | $1,821 | $60,456 | $8,000 | $52,456 |
| 2018 | $1,077 | $58,792 | $8,000 | $50,792 |
| 2017 | $1,554 | $52,720 | $8,000 | $44,720 |
| 2016 | $1,450 | $47,956 | $8,000 | $39,956 |
| 2015 | $1,121 | $36,420 | $8,000 | $28,420 |
| 2014 | $1,177 | $37,280 | $8,000 | $29,280 |
| 2013 | -- | $21,320 | $8,000 | $13,320 |
Source: Public Records
Map
Nearby Homes
- 237 Settlers Mill Run
- 85 Settlers Mill Run
- 71 Old Teal Rd
- 14 Woodmill Ct Unit 2
- 663 Hiram Way
- 557 Davis Mill Dr
- 525 Davis Mill Dr
- 114 Prince Ct
- 35 Davis Mill Hollow
- 1019 Davis Mill Rd S
- 1707 Hiram Sudie Rd
- 290 Mill Pointe Trail
- 242 Barrington Dr
- 409 Barrington Dr
- 117 Southern Oaks Dr
- 75 Clay Ct
- 103 Live Oak Ct
- 511 Lakeside Dr
- 494 Campground School Rd
- 00 Villa Rica Highway 61
- 111 Olde Mill Pointe
- 89 Olde Mill Pointe
- 67 Olde Mill Pointe
- 102 Olde Mill Pointe
- 124 Old Mill Rd Unit PTE
- 86 Old Mill Rd
- 86 Old Mill Rd Unit PTE
- 86 Olde Mill Pte
- 86 Olde Mill Pointe
- 142 Olde Mill Pointe
- 142 Old Mill Rd Unit PTE
- 142 Olde Mill Pointe
- 142 Olde Mill Pointe
- 142 Old Mill Rd
- 68 Old Mill Rd Unit PTE
- 68 Olde Mill Pointe
- 68 Olde Mill Pointe
- 45 Olde Mill Pointe
- 39 Settlers Ridge Ln
- 196 Old Mill Rd Unit PTE
Your Personal Tour Guide
Ask me questions while you tour the home.