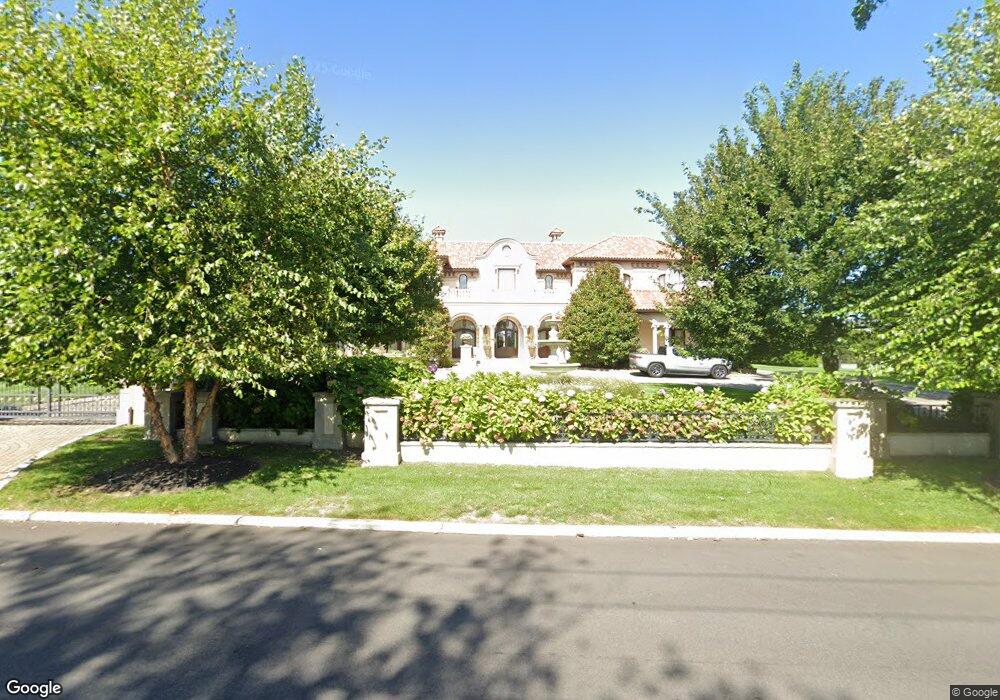
111 Park Ave Long Branch, NJ 07740
Estimated Value: $3,982,000 - $7,880,000
11
Beds
11
Baths
12,107
Sq Ft
$541/Sq Ft
Est. Value
About This Home
This home is located at 111 Park Ave, Long Branch, NJ 07740 and is currently estimated at $6,549,591, approximately $540 per square foot. 111 Park Ave is a home located in Monmouth County with nearby schools including Long Branch High School, Bet Yaakov of the Jersey Shore, and Ma'or Yeshiva High School for Boys.
Ownership History
Date
Name
Owned For
Owner Type
Purchase Details
Closed on
Jul 22, 2020
Sold by
111 Park Avenue Llc
Bought by
111 Park Avenue Llc
Current Estimated Value
Purchase Details
Closed on
Dec 9, 2010
Sold by
Nigri Albert and Nigri Sara
Bought by
111 Park Avenue Llc
Purchase Details
Closed on
Jul 31, 2003
Sold by
Mcdonald Mark
Bought by
Nigri Albert and Nigri Sara
Home Financials for this Owner
Home Financials are based on the most recent Mortgage that was taken out on this home.
Original Mortgage
$1,100,000
Interest Rate
5.98%
Mortgage Type
Purchase Money Mortgage
Purchase Details
Closed on
Jun 27, 2000
Sold by
Jaffe Dora
Bought by
Mcdonald Mark and Stevens Carol
Home Financials for this Owner
Home Financials are based on the most recent Mortgage that was taken out on this home.
Original Mortgage
$616,250
Interest Rate
8.59%
Mortgage Type
Purchase Money Mortgage
Create a Home Valuation Report for This Property
The Home Valuation Report is an in-depth analysis detailing your home's value as well as a comparison with similar homes in the area
Home Values in the Area
Average Home Value in this Area
Purchase History
| Date | Buyer | Sale Price | Title Company |
|---|---|---|---|
| 111 Park Avenue Llc | -- | None Available | |
| 111 Park Avenue Llc | -- | None Available | |
| Nigri Albert | $1,500,000 | -- | |
| Mcdonald Mark | $725,000 | -- |
Source: Public Records
Mortgage History
| Date | Status | Borrower | Loan Amount |
|---|---|---|---|
| Previous Owner | Nigri Albert | $1,100,000 | |
| Previous Owner | Mcdonald Mark | $616,250 |
Source: Public Records
Tax History Compared to Growth
Tax History
| Year | Tax Paid | Tax Assessment Tax Assessment Total Assessment is a certain percentage of the fair market value that is determined by local assessors to be the total taxable value of land and additions on the property. | Land | Improvement |
|---|---|---|---|---|
| 2025 | $97,083 | $6,779,900 | $3,236,400 | $3,543,500 |
| 2024 | $94,317 | $6,316,400 | $2,886,400 | $3,430,000 |
| 2023 | $94,317 | $6,073,200 | $2,761,400 | $3,311,800 |
| 2022 | $92,044 | $5,168,800 | $2,218,000 | $2,950,800 |
| 2021 | $89,791 | $4,599,900 | $1,809,400 | $2,790,500 |
| 2020 | $89,791 | $4,296,200 | $1,521,100 | $2,775,100 |
| 2019 | $87,414 | $4,158,600 | $1,483,100 | $2,675,500 |
| 2018 | $85,598 | $4,049,100 | $1,443,100 | $2,606,000 |
| 2017 | $83,207 | $4,294,300 | $1,493,100 | $2,801,200 |
| 2016 | $85,876 | $4,249,200 | $1,493,100 | $2,756,100 |
| 2015 | $101,812 | $4,571,700 | $1,280,700 | $3,291,000 |
| 2014 | $101,424 | $4,800,000 | $1,369,100 | $3,430,900 |
Source: Public Records
Map
Nearby Homes
- 2 Jim Lynch Dr
- 101 Lincoln Ave
- 251 Highland Ave
- 1 Private Dr
- 280 Cummings Ave
- 1001 Norwood Ave Unit 5
- 1001 Norwood Ave Unit 6
- 1039 Norwood Ave
- 334 Norgrove Place
- 889 Red Oaks Dr
- 881 Red Oaks Dr
- 206 S Lincoln Ave
- 807 Ocean Ave
- 4 Clarence Ave
- 717 Norwood Ave
- 24 Berger Ave
- 3 Reid St
- 735 Greens Ave Unit 18A
- 329 Yorke Ave
- 316 Oakley Ave