S
Seller's Agent in 2015
SIBEL OZ
PROMINENT PROPERTIES SIR
Estimated Value: $660,000 - $777,000
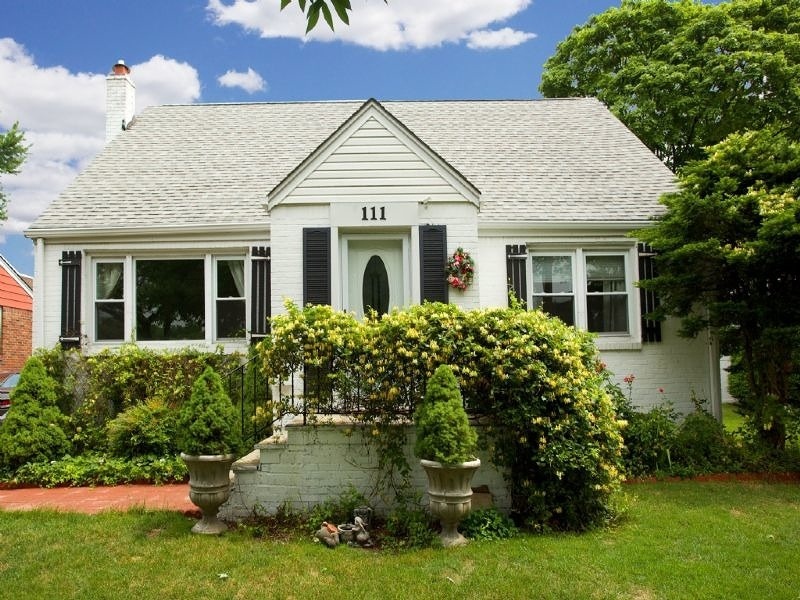
This home is located at 111 Paterson Ave, Hasbrouck Heights, NJ 07604 since 26 August 2015 and is currently estimated at $702,965, approximately $417 per square foot. 111 Paterson Ave is a home located in Bergen County with nearby schools including Hasbrouck Heights High School and Corpus Christi School.
Last Agent to Sell the Property
SIBEL OZ
PROMINENT PROPERTIES SIR Brokerage Phone: 973-783-6900 Listed on: 08/26/2015
| Date | Buyer | Sale Price | Title Company |
|---|---|---|---|
| Elshazly Naglaa | $381,000 | None Available |
| Date | Event | Price | List to Sale | Price per Sq Ft |
|---|---|---|---|---|
| 08/26/2015 08/26/15 | Sold | $381,000 | -- | $226 / Sq Ft |
| Year | Tax Paid | Tax Assessment Tax Assessment Total Assessment is a certain percentage of the fair market value that is determined by local assessors to be the total taxable value of land and additions on the property. | Land | Improvement |
|---|---|---|---|---|
| 2025 | $12,535 | $490,600 | $225,000 | $265,600 |
| 2024 | $12,117 | $490,600 | $225,000 | $265,600 |
| 2023 | $11,266 | $470,200 | $215,000 | $255,200 |
| 2022 | $11,266 | $418,500 | $197,500 | $221,000 |
| 2021 | $10,960 | $388,100 | $185,000 | $203,100 |
| 2020 | $10,230 | $355,700 | $177,500 | $178,200 |
| 2019 | $9,943 | $349,500 | $175,000 | $174,500 |
| 2018 | $9,794 | $343,400 | $172,500 | $170,900 |
| 2017 | $9,630 | $337,200 | $170,000 | $167,200 |
| 2016 | $9,575 | $315,500 | $160,000 | $155,500 |
| 2015 | $9,421 | $315,500 | $160,000 | $155,500 |
| 2014 | $9,162 | $315,500 | $160,000 | $155,500 |
S
Seller's Agent in 2015
SIBEL OZ
PROMINENT PROPERTIES SIR
Source: Garden State MLS
MLS Number: 3229551
APN: 25-00151-01-00029
Disclaimer: Certain information contained herein is derived from information provided by parties other than Homes.com. All information provided is deemed reliable, but is not guaranteed to be accurate and should be independently verified.
![]() The data relating to real estate for sale on this website comes in part from the IDX Program of Garden State Multiple Listing Service, L.L.C. Real estate listings held by other brokerage firms are marked as IDX Listing.
The data relating to real estate for sale on this website comes in part from the IDX Program of Garden State Multiple Listing Service, L.L.C. Real estate listings held by other brokerage firms are marked as IDX Listing.
Information deemed reliable but not guaranteed.
Copyright © 2025 Garden State Multiple Listing Service, L.L.C. All rights reserved.
Notice: The dissemination of listings on this website does not constitute the consent required by N.J.A.C. 11:5.6.1 (n) for the advertisement of listings exclusively for sale by another broker. Any such consent must be obtained in writing from the listing broker.
This information is being provided for Consumers’ personal, non-commercial use and may not be used for any purpose other than to identify prospective properties Consumers may be interested in purchasing.