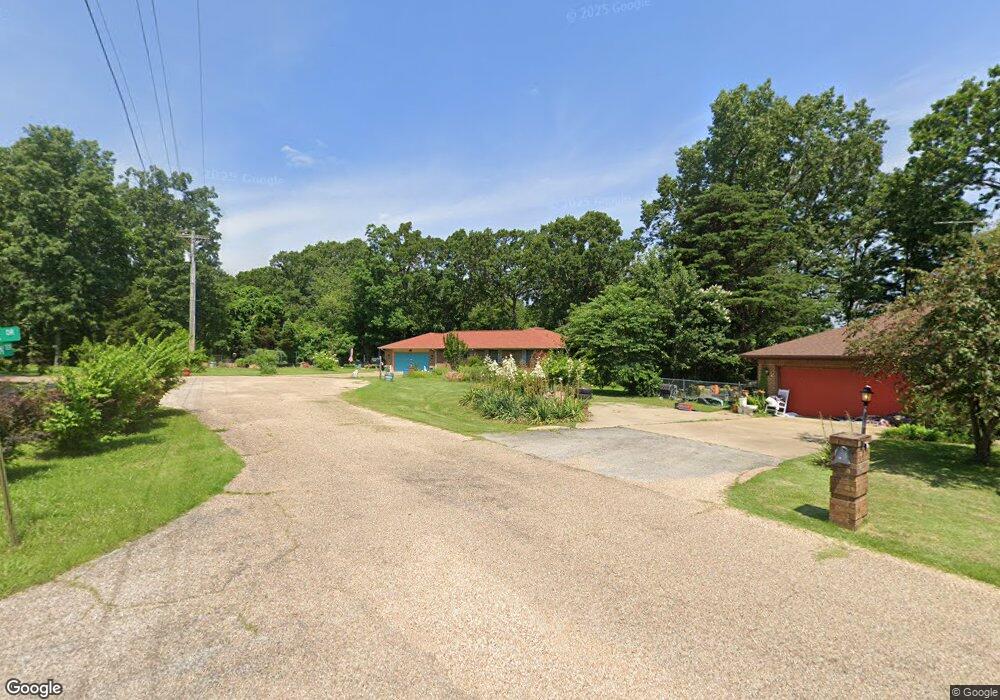
111 Pheasant Run Terrace Mountain Home, AR 72653
Estimated Value: $252,952 - $337,000
3
Beds
3
Baths
1,821
Sq Ft
$157/Sq Ft
Est. Value
About This Home
This home is located at 111 Pheasant Run Terrace, Mountain Home, AR 72653 and is currently estimated at $286,738, approximately $157 per square foot. 111 Pheasant Run Terrace is a home located in Baxter County with nearby schools including Mountain Home Kindergarten, Nelson Wilks Herron Elementary School, and Hackler Intermediate School.
Ownership History
Date
Name
Owned For
Owner Type
Purchase Details
Closed on
Jul 29, 2021
Sold by
Sayen Roger Michael and Sayen Sandra Lane
Bought by
Sayen Roger Michael and Sayen Sandra Lane
Current Estimated Value
Purchase Details
Closed on
May 26, 2016
Sold by
Williams Basil and Williams Aileen
Bought by
Sayen Roger Michael and Sayen Sandra Lane
Home Financials for this Owner
Home Financials are based on the most recent Mortgage that was taken out on this home.
Original Mortgage
$124,000
Interest Rate
3.66%
Mortgage Type
Construction
Purchase Details
Closed on
Sep 28, 2009
Sold by
Strother Lane H
Bought by
Williams Basil and Williams Aileen
Purchase Details
Closed on
Sep 3, 2009
Sold by
Gabbard Lynn L and Gabbard William
Bought by
Strother Lane H and Hardee Family Trust
Purchase Details
Closed on
Nov 1, 1994
Sold by
Not Provided
Bought by
Hardee Jack and Hardee Lela
Create a Home Valuation Report for This Property
The Home Valuation Report is an in-depth analysis detailing your home's value as well as a comparison with similar homes in the area
Home Values in the Area
Average Home Value in this Area
Purchase History
| Date | Buyer | Sale Price | Title Company |
|---|---|---|---|
| Sayen Roger Michael | -- | None Listed On Document | |
| Sayen Roger Michael | -- | None Available | |
| Sayen Roger Michael | -- | Attorney | |
| Williams Basil | -- | -- | |
| Strother Lane H | -- | -- | |
| Hardee Jack | $110,000 | -- |
Source: Public Records
Mortgage History
| Date | Status | Borrower | Loan Amount |
|---|---|---|---|
| Previous Owner | Sayen Roger Michael | $124,000 |
Source: Public Records
Tax History Compared to Growth
Tax History
| Year | Tax Paid | Tax Assessment Tax Assessment Total Assessment is a certain percentage of the fair market value that is determined by local assessors to be the total taxable value of land and additions on the property. | Land | Improvement |
|---|---|---|---|---|
| 2024 | $405 | $33,900 | $3,000 | $30,900 |
| 2023 | $480 | $33,900 | $3,000 | $30,900 |
| 2022 | $530 | $33,900 | $3,000 | $30,900 |
| 2021 | $530 | $27,780 | $3,000 | $24,780 |
| 2020 | $530 | $27,780 | $3,000 | $24,780 |
| 2019 | $548 | $27,780 | $3,000 | $24,780 |
| 2018 | $792 | $27,780 | $3,000 | $24,780 |
| 2017 | $532 | $27,780 | $3,000 | $24,780 |
| 2016 | $514 | $28,930 | $3,000 | $25,930 |
| 2015 | $732 | $28,930 | $3,000 | $25,930 |
| 2014 | $514 | $28,930 | $3,000 | $25,930 |
Source: Public Records
Map
Nearby Homes
- 93 Partridge Dr
- 509 Baypoint Dr
- 175 Partridge Dr
- 36 Partridge Ct
- 82 Baypoint Dr
- Lots 3 & 4 Cr 505
- 485 & 497 Cr 176
- 654 Mallard Point Rd
- 311 Mallard Point Rd
- Lots 3 & 4 County Road 992
- 153 Terry Place
- 6172 Hwy 62 E
- 002-03226-134 Escape Dr
- 164 Mallard Point Rd
- 002-03226-107 Escape Dr
- 5151 Highway 62 E
- 5123 Highway 62 E
- 261 Lake Park Loop
- 66 Cr 959
- 48 County Road 959
- 91 Pheasant Run Terrace
- 110 Pheasant Run Terrace
- 67 Pheasant Run Terrace
- 329 Baypoint Dr
- 16 Partridge Dr
- 363 Baypoint Dr
- 307 Baypoint Dr
- 202 Lowe Dr
- 43 Pheasant Run Terrace
- 387 Baypoint Dr
- 57 Partridge Dr
- 54 Pheasant Run Terrace
- 52 Partridge Dr
- 30 Pheasant Run Terrace
- 440 Ridgeview Dr
- 440 Ridgeview Dr Unit Lot 3
- 407 Baypoint Dr
- 362 Baypoint Dr
- 73 Partridge Dr
- 57 Pheasant Run Way