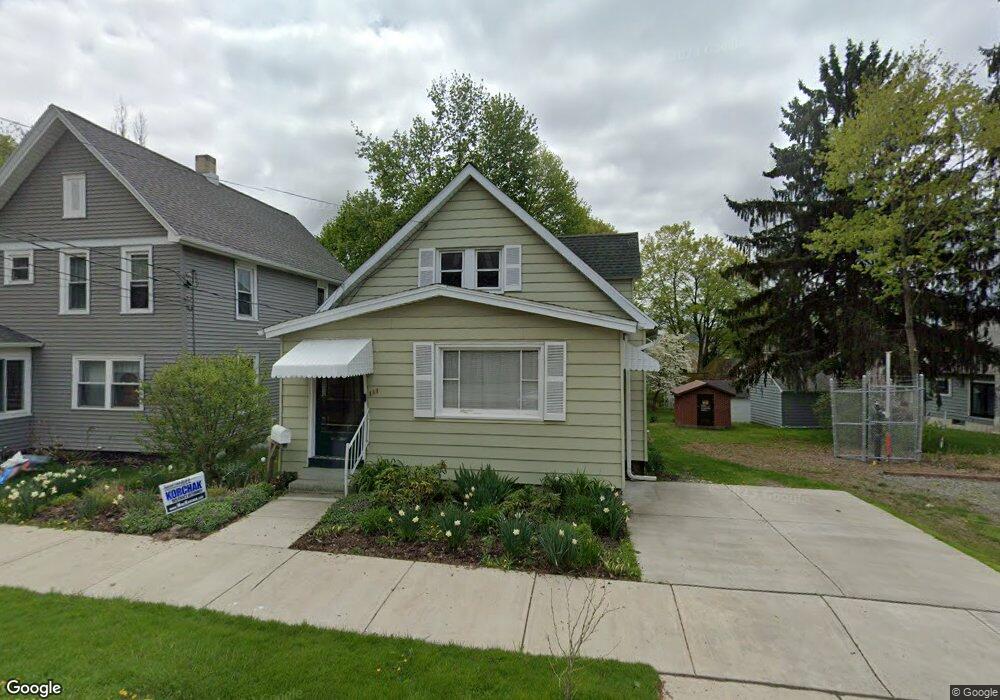
111 Prospect St Binghamton, NY 13905
First Ward NeighborhoodEstimated Value: $88,000 - $100,074
3
Beds
1
Bath
1,496
Sq Ft
$64/Sq Ft
Est. Value
About This Home
This home is located at 111 Prospect St, Binghamton, NY 13905 and is currently estimated at $95,769, approximately $64 per square foot. 111 Prospect St is a home located in Broome County with nearby schools including Woodrow Wilson Elementary School, Binghamton High School, and West Middle School.
Ownership History
Date
Name
Owned For
Owner Type
Purchase Details
Closed on
Feb 11, 2020
Sold by
Ondrako William T
Bought by
Newell Yvonne E
Current Estimated Value
Home Financials for this Owner
Home Financials are based on the most recent Mortgage that was taken out on this home.
Original Mortgage
$51,145
Outstanding Balance
$45,285
Interest Rate
3.6%
Mortgage Type
New Conventional
Estimated Equity
$50,484
Purchase Details
Closed on
May 31, 2017
Sold by
Babish Thomas S
Bought by
Ondrako William T
Create a Home Valuation Report for This Property
The Home Valuation Report is an in-depth analysis detailing your home's value as well as a comparison with similar homes in the area
Home Values in the Area
Average Home Value in this Area
Purchase History
| Date | Buyer | Sale Price | Title Company |
|---|---|---|---|
| Newell Yvonne E | $53,000 | None Available | |
| Ondrako William T | $18,000 | None Available |
Source: Public Records
Mortgage History
| Date | Status | Borrower | Loan Amount |
|---|---|---|---|
| Open | Newell Yvonne E | $51,145 |
Source: Public Records
Tax History
| Year | Tax Paid | Tax Assessment Tax Assessment Total Assessment is a certain percentage of the fair market value that is determined by local assessors to be the total taxable value of land and additions on the property. | Land | Improvement |
|---|---|---|---|---|
| 2024 | $4,435 | $45,000 | $5,200 | $39,800 |
| 2023 | $4,354 | $45,000 | $5,200 | $39,800 |
| 2022 | $4,252 | $45,000 | $5,200 | $39,800 |
| 2021 | $4,204 | $45,000 | $5,200 | $39,800 |
| 2020 | $2,780 | $45,000 | $5,200 | $39,800 |
| 2019 | $1,419 | $45,000 | $5,200 | $39,800 |
| 2018 | $2,711 | $45,000 | $5,200 | $39,800 |
| 2017 | $1,219 | $45,000 | $5,200 | $39,800 |
| 2016 | $1,230 | $45,000 | $5,200 | $39,800 |
| 2015 | $1,118 | $45,000 | $5,200 | $39,800 |
| 2014 | $1,118 | $45,000 | $5,200 | $39,800 |
Source: Public Records
Map
Nearby Homes
Your Personal Tour Guide
Ask me questions while you tour the home.