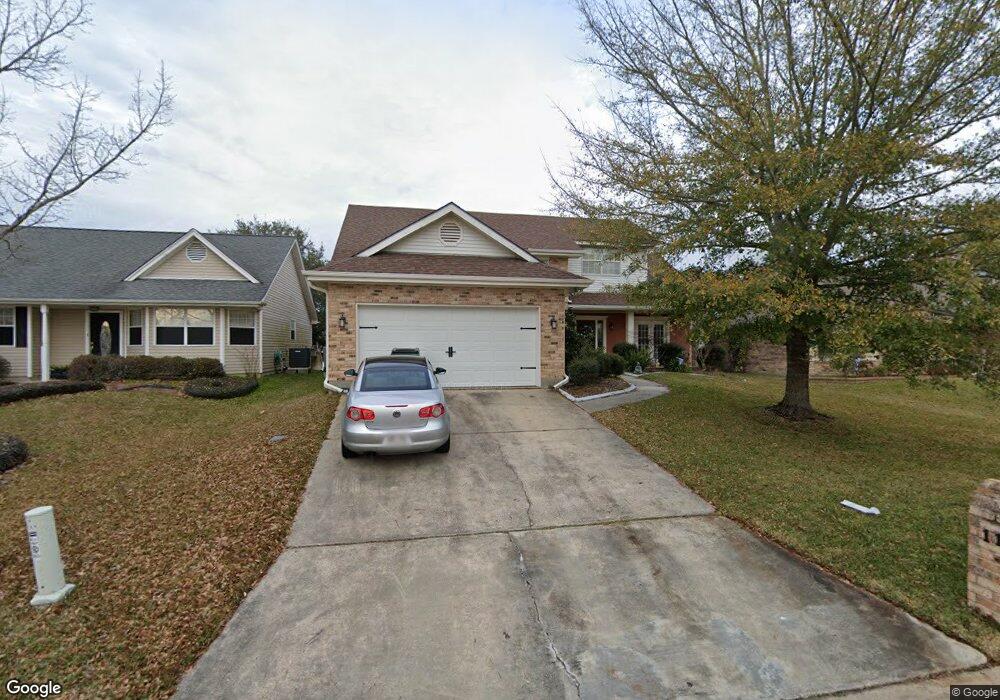
111 Rampage Loop Other Slidell, LA 70458
Estimated Value: $375,302 - $428,000
4
Beds
4
Baths
2,750
Sq Ft
$146/Sq Ft
Est. Value
About This Home
This home is located at 111 Rampage Loop Other, Slidell, LA 70458 and is currently estimated at $402,076, approximately $146 per square foot. 111 Rampage Loop Other is a home located in St. Tammany Parish with nearby schools including W.L. Abney Elementary School, St. Tammany Junior High School, and Salmen High School.
Ownership History
Date
Name
Owned For
Owner Type
Purchase Details
Closed on
Nov 30, 2021
Sold by
Horton William Richard and Horton Terri Janice
Bought by
Hawks Timothy and Hawks Jeanette Wood
Current Estimated Value
Home Financials for this Owner
Home Financials are based on the most recent Mortgage that was taken out on this home.
Original Mortgage
$399,877
Outstanding Balance
$363,871
Interest Rate
3.09%
Mortgage Type
New Conventional
Estimated Equity
$38,205
Purchase Details
Closed on
Jun 25, 2009
Sold by
Hess Janice Hanley and Hess Lawrence R
Bought by
Horton Terri Janice and Horton Terri Vanlandingham
Home Financials for this Owner
Home Financials are based on the most recent Mortgage that was taken out on this home.
Original Mortgage
$288,000
Interest Rate
4.97%
Mortgage Type
New Conventional
Create a Home Valuation Report for This Property
The Home Valuation Report is an in-depth analysis detailing your home's value as well as a comparison with similar homes in the area
Home Values in the Area
Average Home Value in this Area
Purchase History
| Date | Buyer | Sale Price | Title Company |
|---|---|---|---|
| Hawks Timothy | $393,000 | Bayou Title Inc | |
| Horton Terri Janice | $320,000 | Mahony Title & Land Services |
Source: Public Records
Mortgage History
| Date | Status | Borrower | Loan Amount |
|---|---|---|---|
| Open | Hawks Timothy | $399,877 | |
| Previous Owner | Horton Terri Janice | $288,000 |
Source: Public Records
Tax History
| Year | Tax Paid | Tax Assessment Tax Assessment Total Assessment is a certain percentage of the fair market value that is determined by local assessors to be the total taxable value of land and additions on the property. | Land | Improvement |
|---|---|---|---|---|
| 2025 | $3,893 | $38,182 | $4,800 | $33,382 |
| 2024 | $3,893 | $38,182 | $4,800 | $33,382 |
| 2023 | $4,052 | $30,303 | $4,000 | $26,303 |
| 2022 | $333,769 | $30,303 | $4,000 | $26,303 |
| 2021 | $3,333 | $30,303 | $4,000 | $26,303 |
| 2020 | $3,316 | $30,303 | $4,000 | $26,303 |
| 2019 | $4,113 | $27,316 | $4,000 | $23,316 |
| 2018 | $4,128 | $27,316 | $4,000 | $23,316 |
| 2017 | $4,155 | $27,316 | $4,000 | $23,316 |
| 2016 | $4,252 | $27,316 | $4,000 | $23,316 |
| 2015 | $2,927 | $25,709 | $6,000 | $19,709 |
| 2014 | $2,872 | $25,709 | $6,000 | $19,709 |
| 2013 | -- | $25,709 | $6,000 | $19,709 |
Source: Public Records
Map
Nearby Homes
- 107 Anita Place
- 0 Intrepid Dr
- 204 Chubasco Ln
- 234 Constellation Dr
- 205 Windward Passage St
- 229 Constellation Dr
- 222 Windward Passage St
- 301 Windward Passage St
- 310 Windward Passage St
- 311 Windward Passage St
- 302 Charles Ct
- 103 Gretel Cove
- 301 Windward Passage None
- 212 Eydie Ln
- 111 Columbia Place
- 311 Windward Passage None
- 118 Windward Passage St
- 129 Blackfin Cove
- 111 Rampage Loop
- 109 Rampage Loop
- 113 Rampage Loop
- 115 Rampage Loop
- 107 Rampage Loop
- 117 Rampage Other
- 117 Rampage Loop Other
- 117 Rampage Loop
- 105 Rampage Loop
- 110 Anita Place
- 103 Rampage Loop
- 119 Rampage Loop Other
- 119 Rampage Loop
- 0 L468 Rampage Loop
- 119 Rampage Other
- 108 Anita Place
- 124 Rampage Loop
- 104 Anita Place
- 122 Rampage Loop Other
- 106 Rampage Loop Other
Your Personal Tour Guide
Ask me questions while you tour the home.