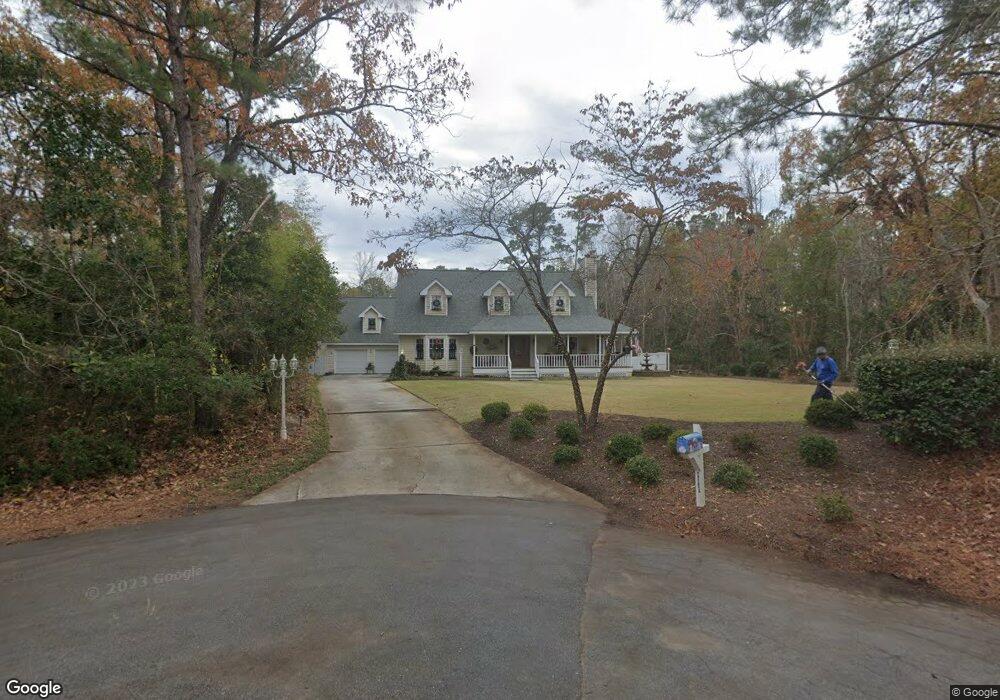
111 Ransey Ct Hampstead, NC 28443
Estimated Value: $493,208 - $615,000
4
Beds
3
Baths
2,852
Sq Ft
$193/Sq Ft
Est. Value
About This Home
This home is located at 111 Ransey Ct, Hampstead, NC 28443 and is currently estimated at $551,302, approximately $193 per square foot. 111 Ransey Ct is a home located in Pender County with nearby schools including Topsail Elementary School, Topsail Middle School, and Topsail High School.
Ownership History
Date
Name
Owned For
Owner Type
Purchase Details
Closed on
Jul 16, 2014
Sold by
Pool Mark David and Pool Sharon Canady
Bought by
Pool Mark David and Pool Sharon Canady
Current Estimated Value
Home Financials for this Owner
Home Financials are based on the most recent Mortgage that was taken out on this home.
Original Mortgage
$162,000
Outstanding Balance
$51,523
Interest Rate
4.2%
Mortgage Type
New Conventional
Estimated Equity
$499,779
Create a Home Valuation Report for This Property
The Home Valuation Report is an in-depth analysis detailing your home's value as well as a comparison with similar homes in the area
Home Values in the Area
Average Home Value in this Area
Purchase History
| Date | Buyer | Sale Price | Title Company |
|---|---|---|---|
| Pool Mark David | -- | None Available |
Source: Public Records
Mortgage History
| Date | Status | Borrower | Loan Amount |
|---|---|---|---|
| Open | Pool Mark David | $162,000 |
Source: Public Records
Tax History Compared to Growth
Tax History
| Year | Tax Paid | Tax Assessment Tax Assessment Total Assessment is a certain percentage of the fair market value that is determined by local assessors to be the total taxable value of land and additions on the property. | Land | Improvement |
|---|---|---|---|---|
| 2024 | $2,988 | $301,417 | $41,918 | $259,499 |
| 2023 | $2,988 | $301,417 | $41,918 | $259,499 |
| 2022 | $2,729 | $301,417 | $41,918 | $259,499 |
| 2021 | $2,729 | $301,417 | $41,918 | $259,499 |
| 2020 | $2,729 | $301,417 | $41,918 | $259,499 |
| 2019 | $2,729 | $301,417 | $41,918 | $259,499 |
| 2018 | $2,768 | $291,981 | $60,000 | $231,981 |
| 2017 | $2,768 | $291,981 | $60,000 | $231,981 |
| 2016 | $2,738 | $291,981 | $60,000 | $231,981 |
| 2015 | $2,703 | $291,981 | $60,000 | $231,981 |
| 2014 | $2,041 | $291,981 | $60,000 | $231,981 |
| 2013 | -- | $291,981 | $60,000 | $231,981 |
| 2012 | -- | $291,981 | $60,000 | $231,981 |
Source: Public Records
Map
Nearby Homes
- 136 S Belvedere Dr
- 732 Azalea Dr Unit 413
- 732 Azalea Dr Unit 406
- 100 Southern Magnolia Ct
- 724 Azalea Dr Unit 439
- 101 Southern Magnolia Ct
- 718 Azalea Dr Unit 458
- 103 Holly Tree Ln
- 702 Azalea Dr Unit 495
- 119 Red Bird Ln
- 131 Holly Tree Ln
- 124 Holly Tree Ln
- 1509 Country Club Dr
- 129 Red Bird Ln
- 111 Bay Tree Cir
- 107 Mooney Ct
- 220 Hickory Ln
- 123 Penquin Place
- Blanco Plan at Southwater Village
- 113 Umbrella Palm Dr
- 113 S Belvedere Dr
- 115 S Belvedere Dr
- 129 S Belvedere Dr
- 116 Ransey Ct
- 114 Ransey Ct
- 117 S Belvedere Dr
- Lot 142 Belvedere S
- 116 S Belvedere Dr
- 110 S Belvedere Dr
- 118 S Belvedere Dr
- 2070 Country Club Dr
- 2070 Country Club Dr
- 108 S Belvedere Dr
- 2094 Country Club Dr
- 2094 Country Club Dr
- 120 S Belvedere Dr
- 106 S Belvedere Dr
- 122 S Belvedere Dr
- 122 S Belvedere Dr
- 51 S Belvedere Dr