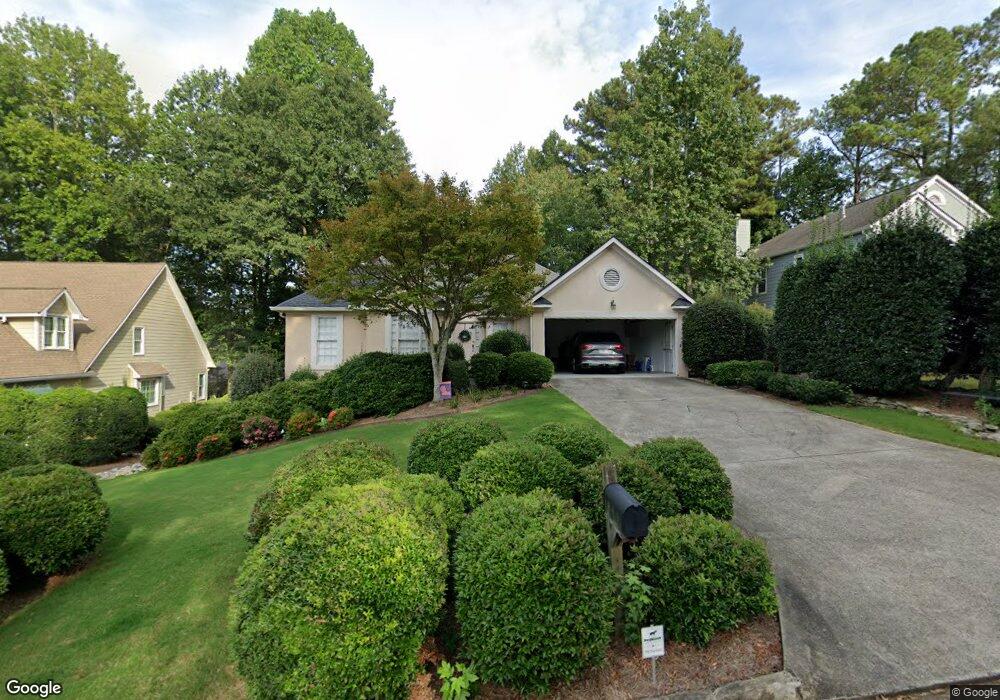
111 Red Oak Ln Alpharetta, GA 30009
Estimated Value: $555,000 - $686,000
3
Beds
2
Baths
1,790
Sq Ft
$343/Sq Ft
Est. Value
About This Home
This home is located at 111 Red Oak Ln, Alpharetta, GA 30009 and is currently estimated at $614,661, approximately $343 per square foot. 111 Red Oak Ln is a home located in Fulton County with nearby schools including Manning Oaks Elementary School, Hopewell Middle School, and Alpharetta High School.
Ownership History
Date
Name
Owned For
Owner Type
Purchase Details
Closed on
May 16, 2019
Sold by
Freeport Title & Guaranty Inc Trustee
Bought by
Ross Steven B and Ross Danielle F
Current Estimated Value
Purchase Details
Closed on
Jul 9, 2003
Sold by
111 Red Oak Lane Land Trust
Bought by
Ross Danielle
Home Financials for this Owner
Home Financials are based on the most recent Mortgage that was taken out on this home.
Original Mortgage
$137,800
Interest Rate
5.24%
Mortgage Type
New Conventional
Purchase Details
Closed on
Aug 8, 2001
Sold by
Ross Danielle F
Bought by
Freeport Title & Guaranty Inc
Purchase Details
Closed on
Jul 10, 2001
Sold by
Ross Danielle
Bought by
111 Red Oak Lane Land Trust
Purchase Details
Closed on
Mar 27, 2001
Sold by
Ross Danielle F
Bought by
Ross Danielle F and Ross Steve
Home Financials for this Owner
Home Financials are based on the most recent Mortgage that was taken out on this home.
Original Mortgage
$148,000
Interest Rate
6.99%
Mortgage Type
New Conventional
Create a Home Valuation Report for This Property
The Home Valuation Report is an in-depth analysis detailing your home's value as well as a comparison with similar homes in the area
Home Values in the Area
Average Home Value in this Area
Purchase History
| Date | Buyer | Sale Price | Title Company |
|---|---|---|---|
| Ross Steven B | -- | -- | |
| Ross Danielle | -- | -- | |
| Freeport Title & Guaranty Inc | -- | -- | |
| 111 Red Oak Lane Land Trust | -- | -- | |
| Ross Danielle F | -- | -- | |
| Ross Danielle F | $185,000 | -- |
Source: Public Records
Mortgage History
| Date | Status | Borrower | Loan Amount |
|---|---|---|---|
| Previous Owner | Ross Danielle | $137,800 | |
| Previous Owner | Ross Danielle F | $148,000 |
Source: Public Records
Tax History Compared to Growth
Tax History
| Year | Tax Paid | Tax Assessment Tax Assessment Total Assessment is a certain percentage of the fair market value that is determined by local assessors to be the total taxable value of land and additions on the property. | Land | Improvement |
|---|---|---|---|---|
| 2025 | $1,299 | $215,480 | $65,080 | $150,400 |
| 2023 | $7,140 | $252,960 | $51,840 | $201,120 |
| 2022 | $4,703 | $178,760 | $31,920 | $146,840 |
| 2021 | $4,633 | $140,920 | $30,040 | $110,880 |
| 2020 | $4,280 | $127,600 | $33,400 | $94,200 |
| 2019 | $721 | $125,360 | $32,800 | $92,560 |
| 2018 | $3,455 | $122,400 | $32,040 | $90,360 |
| 2017 | $1,697 | $58,160 | $14,040 | $44,120 |
| 2016 | $1,697 | $58,160 | $14,040 | $44,120 |
| 2015 | $2,039 | $58,160 | $14,040 | $44,120 |
| 2014 | $1,783 | $58,160 | $14,040 | $44,120 |
Source: Public Records
Map
Nearby Homes
- 161 Red Oak Ln
- 221 Academy St
- 2600 Milford Ln
- 2540 Milford Ln
- 12120 Dancliff Trace
- 2555 Milford Ln
- 11715 Dancliff Trace
- 208 Wade Creek Rd
- 11945 Dancliff Trace
- 11750 Dancliff Trace
- 126 Academy St
- 272 Thompson St
- 276 Thompson St
- 122 Academy St
- 105 Martin Run
- 205 Chiswick Cir
- Lot 7 Plan at 1858 Downtown
- Lot 9 Plan at 1858 Downtown
- 355 Cricket Ln
- 111 Red Oak Ln
- 121 Red Oak Ln
- 101 Red Oak Ln
- 5201 Village Green Way
- 5207 Village Green Way
- 5195 Village Green Way
- 131 Red Oak Ln
- 5213 Village Green Way
- 5189 Village Green Way
- 310 Oak Terrace
- 5183 Village Green Way
- 301 Oak Terrace
- 0 Donnelath Place Unit 3182871
- 0 Donnelath Place Unit 7374003
- 0 Donnelath Place Unit 7403607
- 0 Donnelath Place Unit 7144106
- 0 Donnelath Place Unit 3228620
- 0 Donnelath Place Unit 8563510
- 0 Donnelath Place Unit 8379335
- 0 Donnelath Place Unit 8349582