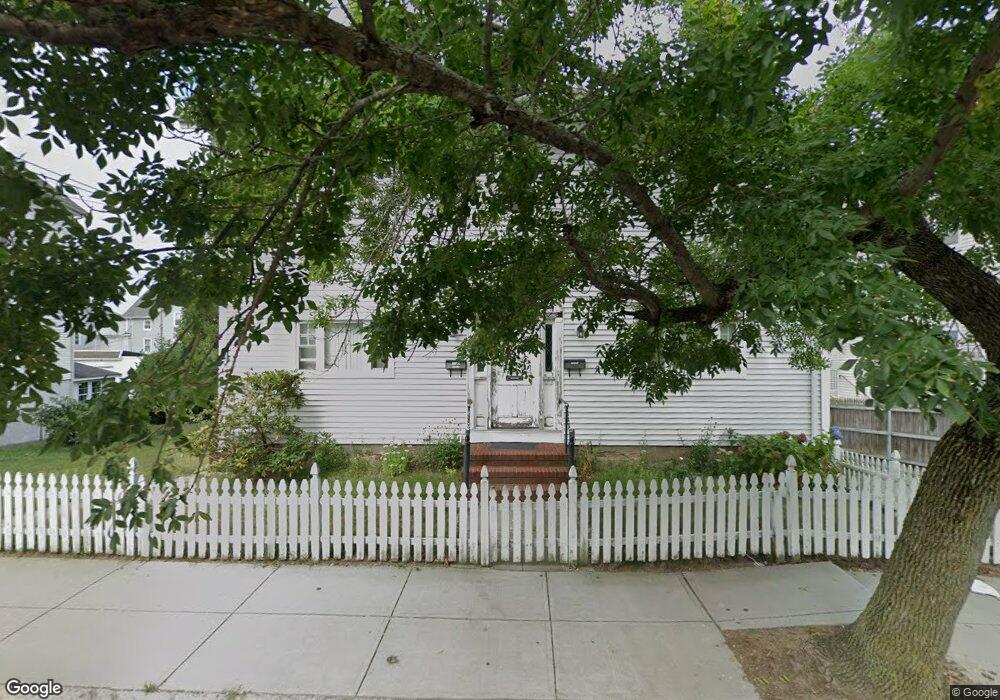
111 Ridge St Fall River, MA 02721
Corky Row NeighborhoodEstimated Value: $483,539 - $574,000
5
Beds
2
Baths
3,170
Sq Ft
$169/Sq Ft
Est. Value
About This Home
This home is located at 111 Ridge St, Fall River, MA 02721 and is currently estimated at $537,135, approximately $169 per square foot. 111 Ridge St is a home located in Bristol County with nearby schools including Henry Lord Community School, B M C Durfee High School, and Argosy Collegiate Charter School.
Ownership History
Date
Name
Owned For
Owner Type
Purchase Details
Closed on
Aug 27, 2003
Sold by
Caetano Antonio G and Rego Antonio
Bought by
Daanunciacao M Helena and Daanunciacao Paulo J
Current Estimated Value
Home Financials for this Owner
Home Financials are based on the most recent Mortgage that was taken out on this home.
Original Mortgage
$200,000
Outstanding Balance
$89,257
Interest Rate
5.69%
Mortgage Type
Purchase Money Mortgage
Estimated Equity
$447,878
Purchase Details
Closed on
Jan 26, 1995
Sold by
Freitas John C and Freitas Anna R
Bought by
Caetano Antonio C and Caetano Elizabeth C
Home Financials for this Owner
Home Financials are based on the most recent Mortgage that was taken out on this home.
Original Mortgage
$140,125
Interest Rate
9.24%
Mortgage Type
Purchase Money Mortgage
Create a Home Valuation Report for This Property
The Home Valuation Report is an in-depth analysis detailing your home's value as well as a comparison with similar homes in the area
Home Values in the Area
Average Home Value in this Area
Purchase History
| Date | Buyer | Sale Price | Title Company |
|---|---|---|---|
| Daanunciacao M Helena | $250,000 | -- | |
| Caetano Antonio C | $147,500 | -- |
Source: Public Records
Mortgage History
| Date | Status | Borrower | Loan Amount |
|---|---|---|---|
| Open | Caetano Antonio C | $200,000 | |
| Previous Owner | Caetano Antonio C | $140,125 |
Source: Public Records
Tax History
| Year | Tax Paid | Tax Assessment Tax Assessment Total Assessment is a certain percentage of the fair market value that is determined by local assessors to be the total taxable value of land and additions on the property. | Land | Improvement |
|---|---|---|---|---|
| 2025 | $5,335 | $465,900 | $114,100 | $351,800 |
| 2024 | $4,855 | $422,500 | $109,900 | $312,600 |
| 2023 | $4,641 | $378,200 | $90,800 | $287,400 |
| 2022 | $4,272 | $338,500 | $86,500 | $252,000 |
| 2021 | $3,917 | $283,200 | $82,300 | $200,900 |
| 2020 | $3,475 | $240,500 | $81,100 | $159,400 |
| 2019 | $3,283 | $225,200 | $78,100 | $147,100 |
| 2018 | $2,874 | $196,600 | $84,600 | $112,000 |
| 2017 | $2,604 | $186,000 | $80,600 | $105,400 |
| 2016 | $2,568 | $188,400 | $85,800 | $102,600 |
| 2015 | $2,464 | $188,400 | $85,800 | $102,600 |
| 2014 | $2,462 | $195,700 | $83,300 | $112,400 |
Source: Public Records
Map
Nearby Homes
- 111 Ridge St Unit 2
- 123 Ridge St
- 99 Ridge St
- 31 South St
- 133 Ridge St
- 546 S Main St
- 54 Cottage St
- 54 Cottage St Unit 2
- 54 Cottage St Unit 3
- 19 South St
- 114 Ridge St
- 114 Ridge St Unit 2
- 76 Cottage St
- 126 Ridge St
- 60 Cottage St
- 60 Cottage St Unit 2
- 546-548 S Main St
- 149 Ridge St
- 149 Ridge St Unit 3
- 134 Ridge St
Your Personal Tour Guide
Ask me questions while you tour the home.