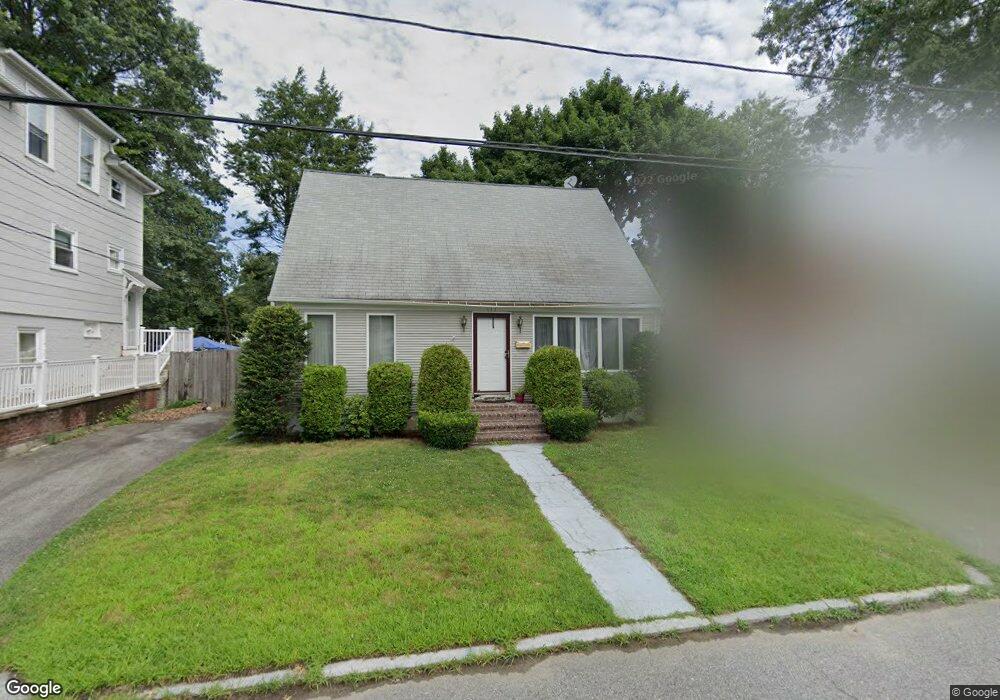
111 Rome Ave Providence, RI 02908
Elmhurst NeighborhoodEstimated Value: $469,999 - $554,000
3
Beds
3
Baths
2,420
Sq Ft
$209/Sq Ft
Est. Value
About This Home
This home is located at 111 Rome Ave, Providence, RI 02908 and is currently estimated at $505,000, approximately $208 per square foot. 111 Rome Ave is a home located in Providence County with nearby schools including St. Augustine School, St. Pius V Catholic School, and La Salle Academy.
Ownership History
Date
Name
Owned For
Owner Type
Purchase Details
Closed on
Aug 25, 2005
Sold by
Pineyro Carlos R
Bought by
Muriel Natasha K and Pena Minoska
Current Estimated Value
Home Financials for this Owner
Home Financials are based on the most recent Mortgage that was taken out on this home.
Original Mortgage
$260,000
Outstanding Balance
$133,299
Interest Rate
5.68%
Mortgage Type
Purchase Money Mortgage
Estimated Equity
$371,701
Purchase Details
Closed on
May 31, 2002
Sold by
Decarlo Robert R and Decarlo Lynn A
Bought by
Pineyro Carlos
Purchase Details
Closed on
Dec 23, 1996
Sold by
Spinella David M and Spinella Judith
Bought by
Decarlo Robert R and Decarlo Lynn
Create a Home Valuation Report for This Property
The Home Valuation Report is an in-depth analysis detailing your home's value as well as a comparison with similar homes in the area
Home Values in the Area
Average Home Value in this Area
Purchase History
| Date | Buyer | Sale Price | Title Company |
|---|---|---|---|
| Muriel Natasha K | $290,000 | -- | |
| Pineyro Carlos | $165,000 | -- | |
| Decarlo Robert R | $114,000 | -- |
Source: Public Records
Mortgage History
| Date | Status | Borrower | Loan Amount |
|---|---|---|---|
| Open | Decarlo Robert R | $260,000 | |
| Previous Owner | Decarlo Robert R | $221,100 | |
| Previous Owner | Decarlo Robert R | $173,300 |
Source: Public Records
Tax History
| Year | Tax Paid | Tax Assessment Tax Assessment Total Assessment is a certain percentage of the fair market value that is determined by local assessors to be the total taxable value of land and additions on the property. | Land | Improvement |
|---|---|---|---|---|
| 2025 | $3,525 | $419,600 | $163,000 | $256,600 |
| 2024 | $5,989 | $326,400 | $106,000 | $220,400 |
| 2023 | $5,989 | $326,400 | $106,000 | $220,400 |
| 2022 | $5,810 | $326,400 | $106,000 | $220,400 |
| 2021 | $5,929 | $241,400 | $84,800 | $156,600 |
| 2020 | $5,929 | $241,400 | $84,800 | $156,600 |
| 2019 | $5,929 | $241,400 | $84,800 | $156,600 |
| 2018 | $6,408 | $200,500 | $68,200 | $132,300 |
| 2017 | $6,408 | $200,500 | $68,200 | $132,300 |
| 2016 | $6,408 | $200,500 | $68,200 | $132,300 |
| 2015 | $5,912 | $178,600 | $68,200 | $110,400 |
| 2014 | $6,028 | $178,600 | $68,200 | $110,400 |
| 2013 | $6,028 | $178,600 | $68,200 | $110,400 |
Source: Public Records
Map
Nearby Homes
- 117 Rome Ave
- 117 Rome Ave Unit 2
- 117 Rome Ave Unit 1
- 105 Rome Ave
- 110 Naples Ave
- 106 Naples Ave
- 101 Rome Ave
- 171 Enfield Ave
- 167 Enfield Ave
- 175 Enfield Ave
- 104 Naples Ave
- 118 Rome Ave
- 108 Rome Ave
- 110 Rome Ave
- 159 Enfield Ave
- 159 Enfield Ave Unit 2
- 179 Enfield Ave
- 95 Rome Ave
- 102 Rome Ave
- 94 Naples Ave
Your Personal Tour Guide
Ask me questions while you tour the home.