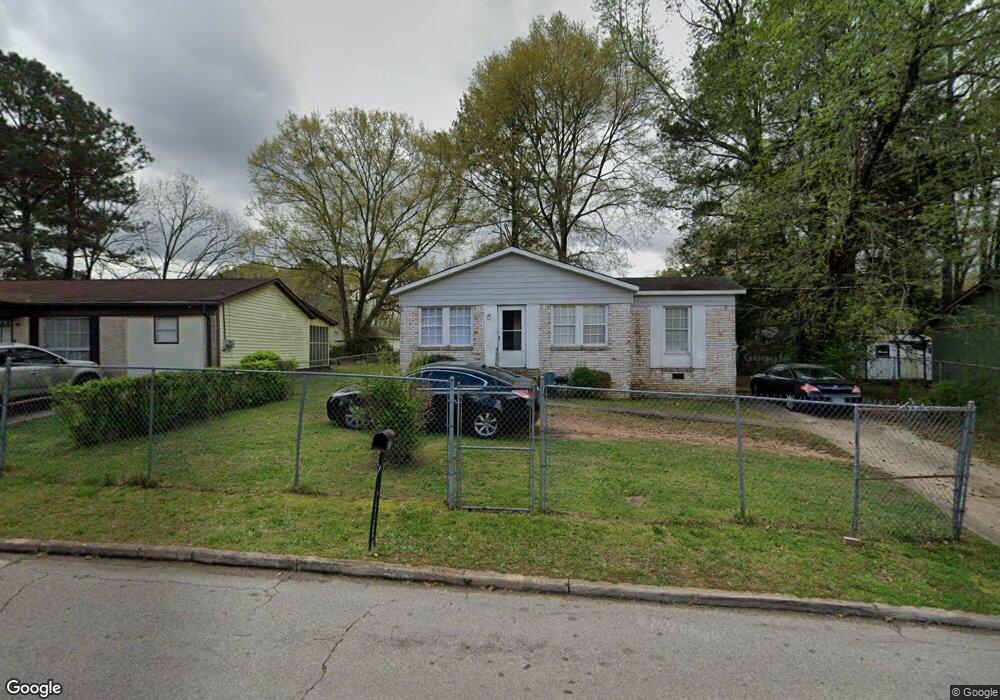
111 Royal Ct Lagrange, GA 30241
Estimated Value: $111,300 - $137,000
3
Beds
2
Baths
1,081
Sq Ft
$116/Sq Ft
Est. Value
About This Home
This home is located at 111 Royal Ct, Lagrange, GA 30241 and is currently estimated at $125,325, approximately $115 per square foot. 111 Royal Ct is a home located in Troup County with nearby schools including Callaway Elementary School, Hogansville Elementary School, and Callaway Middle School.
Ownership History
Date
Name
Owned For
Owner Type
Purchase Details
Closed on
Mar 22, 2002
Sold by
Davis E C
Bought by
Barsh Janice
Current Estimated Value
Purchase Details
Closed on
Apr 26, 2001
Sold by
Federal National Mortgage
Bought by
Davis E C
Purchase Details
Closed on
Jul 6, 2000
Sold by
Synovus Mortgage Corp
Bought by
Federal National Mortgage
Purchase Details
Closed on
Jul 5, 2000
Sold by
Asberry Warner
Bought by
Synovus Mortgage Corp
Purchase Details
Closed on
Oct 10, 1995
Sold by
Elizabeth Dowell
Bought by
Asberry Warner
Purchase Details
Closed on
Oct 18, 1977
Sold by
Secretary Of Housing & Urban
Bought by
Elizabeth Dowell
Purchase Details
Closed on
Mar 18, 1977
Sold by
Collier Jimmy and Collier Iris
Bought by
Secretary Of Housing & Urban
Purchase Details
Closed on
Jan 1, 1971
Bought by
Collier Jimmy and Collier Iris
Create a Home Valuation Report for This Property
The Home Valuation Report is an in-depth analysis detailing your home's value as well as a comparison with similar homes in the area
Purchase History
| Date | Buyer | Sale Price | Title Company |
|---|---|---|---|
| Barsh Janice | $65,000 | -- | |
| Davis E C | $20,000 | -- | |
| Federal National Mortgage | $38,500 | -- | |
| Synovus Mortgage Corp | $38,500 | -- | |
| Asberry Warner | $35,000 | -- | |
| Elizabeth Dowell | -- | -- | |
| Secretary Of Housing & Urban | -- | -- | |
| Collier Jimmy | -- | -- |
Source: Public Records
Tax History
| Year | Tax Paid | Tax Assessment Tax Assessment Total Assessment is a certain percentage of the fair market value that is determined by local assessors to be the total taxable value of land and additions on the property. | Land | Improvement |
|---|---|---|---|---|
| 2025 | $960 | $35,200 | $2,960 | $32,240 |
| 2024 | $885 | $32,440 | $2,960 | $29,480 |
| 2023 | $752 | $27,560 | $2,960 | $24,600 |
| 2022 | $732 | $26,240 | $2,960 | $23,280 |
| 2021 | $554 | $18,360 | $2,680 | $15,680 |
| 2020 | $554 | $18,360 | $2,680 | $15,680 |
| 2019 | $502 | $16,628 | $2,748 | $13,880 |
| 2018 | $501 | $16,628 | $2,748 | $13,880 |
| 2017 | $501 | $16,628 | $2,748 | $13,880 |
| 2016 | $494 | $16,392 | $2,748 | $13,644 |
| 2015 | $495 | $16,392 | $2,748 | $13,644 |
| 2014 | $474 | $15,674 | $2,748 | $12,926 |
| 2013 | -- | $16,848 | $2,748 | $14,100 |
Source: Public Records
Map
Nearby Homes
- 114 Brenda Blvd
- 130 Edgewood Ave
- 1404 Hamilton Rd
- 1404-1406 Hamilton
- 901 Whiteline St
- 0 E Fendig St
- 113 E Fendig St
- 304 Butler St
- 0 Boggs St Unit 10550243
- 0 Boggs St Unit 10550231
- 0 Boggs St Unit 10550239
- 0 Boggs St Unit 10550250
- 109 Bell St
- 0 Bagley St
- 213 Euclid Ave
- 216 Euclid Ave
- 112 Cedar St
- LOT 33 E Hillside Dr
- LOT 34 E Hillside Dr
- 101 Cedar St
Your Personal Tour Guide
Ask me questions while you tour the home.