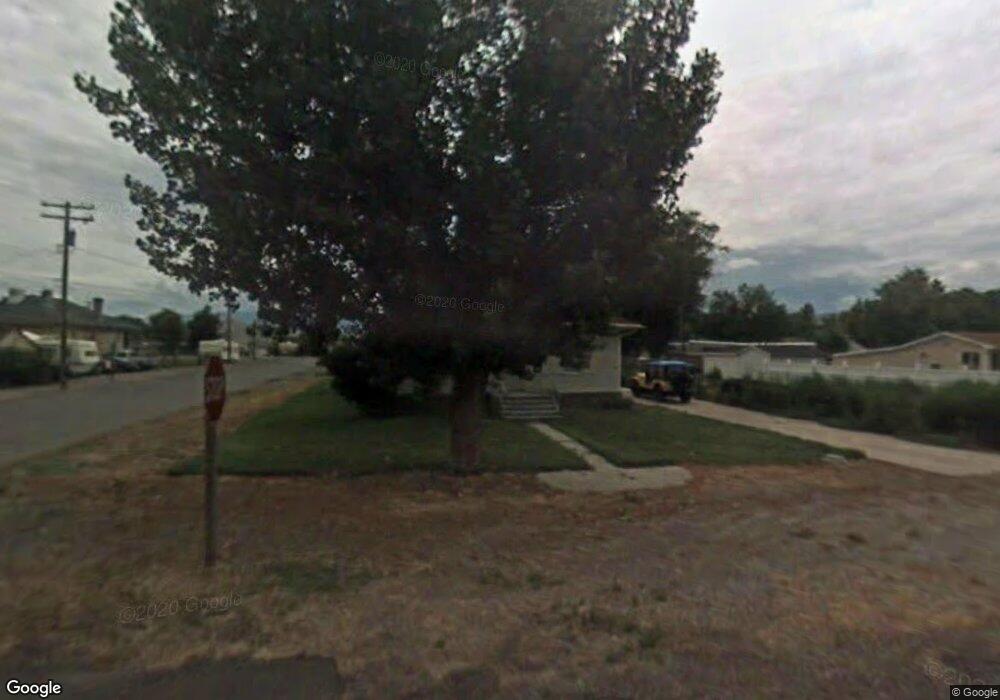
111 S 100 E Redmond, UT 84652
Estimated Value: $183,000 - $242,000
1
Bed
1
Bath
900
Sq Ft
$236/Sq Ft
Est. Value
About This Home
This home is located at 111 S 100 E, Redmond, UT 84652 and is currently estimated at $212,285, approximately $235 per square foot. 111 S 100 E is a home located in Sevier County with nearby schools including Salina School, North Sevier Middle School, and North Sevier High School.
Ownership History
Date
Name
Owned For
Owner Type
Purchase Details
Closed on
Oct 25, 2007
Sold by
Livingston Travis D and Livingston Pamela
Bought by
Mceown Kenneth R
Current Estimated Value
Purchase Details
Closed on
Feb 1, 2007
Sold by
Federal Home Loan Mortgage Corporation
Bought by
Livingston Travis D and Livingston Pamela
Home Financials for this Owner
Home Financials are based on the most recent Mortgage that was taken out on this home.
Original Mortgage
$31,757
Interest Rate
6.19%
Mortgage Type
Purchase Money Mortgage
Purchase Details
Closed on
Aug 1, 2006
Sold by
Matherson Sturart T
Bought by
Federal Home Loan Mortgage Corporation
Create a Home Valuation Report for This Property
The Home Valuation Report is an in-depth analysis detailing your home's value as well as a comparison with similar homes in the area
Purchase History
| Date | Buyer | Sale Price | Title Company |
|---|---|---|---|
| Mceown Kenneth R | -- | First American Title Insuran | |
| Livingston Travis D | -- | First American Title Co | |
| Federal Home Loan Mortgage Corporation | -- | None Available |
Source: Public Records
Mortgage History
| Date | Status | Borrower | Loan Amount |
|---|---|---|---|
| Previous Owner | Livingston Travis D | $31,757 |
Source: Public Records
Tax History
| Year | Tax Paid | Tax Assessment Tax Assessment Total Assessment is a certain percentage of the fair market value that is determined by local assessors to be the total taxable value of land and additions on the property. | Land | Improvement |
|---|---|---|---|---|
| 2025 | $1,638 | $193,715 | $42,889 | $150,826 |
| 2024 | $1,638 | $192,441 | $39,563 | $152,878 |
| 2023 | $1,662 | $193,066 | $39,871 | $153,195 |
| 2022 | $2,031 | $205,286 | $42,213 | $163,073 |
| 2021 | $1,514 | $126,595 | $23,000 | $103,595 |
| 2020 | $1,426 | $111,844 | $23,000 | $88,844 |
| 2019 | $1,317 | $110,200 | $23,000 | $87,200 |
| 2018 | $1,288 | $95,520 | $20,700 | $74,820 |
| 2017 | $1,310 | $92,750 | $20,700 | $72,050 |
| 2016 | $429 | $86,400 | $0 | $0 |
| 2015 | $429 | $73,310 | $0 | $0 |
| 2014 | $429 | $65,020 | $0 | $0 |
Source: Public Records
Map
Nearby Homes
Your Personal Tour Guide
Ask me questions while you tour the home.