Estimated Value: $459,430 - $512,000
3
Beds
2
Baths
1,590
Sq Ft
$300/Sq Ft
Est. Value
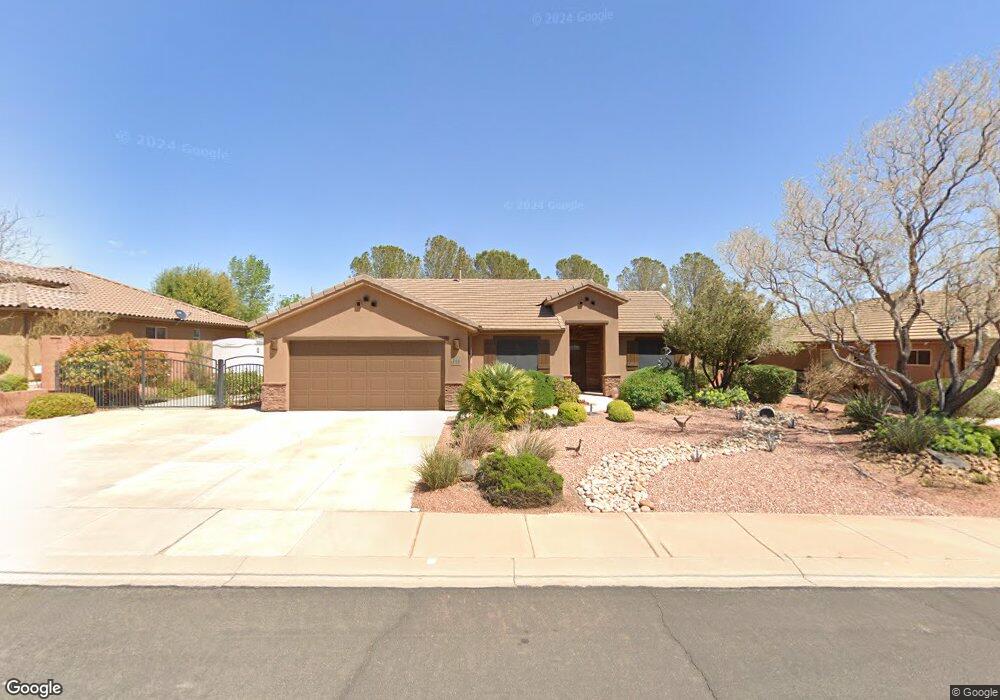
About This Home
This home is located at 111 S 285 W, Ivins, UT 84738 and is currently estimated at $476,608, approximately $299 per square foot. 111 S 285 W is a home located in Washington County with nearby schools including Snow Canyon Middle School, Lava Ridge Intermediate School, and Snow Canyon High School.
Ownership History
Date
Name
Owned For
Owner Type
Purchase Details
Closed on
Dec 20, 2023
Sold by
Lancaster Charles W and Lancaster Maren
Bought by
Lancaster Family Trust and Lancaster
Current Estimated Value
Purchase Details
Closed on
Mar 20, 2009
Sold by
Sun Crest Development Property Llc
Bought by
Lancaster Charles W and Lancaster Maren
Home Financials for this Owner
Home Financials are based on the most recent Mortgage that was taken out on this home.
Original Mortgage
$160,000
Interest Rate
5.19%
Mortgage Type
Unknown
Create a Home Valuation Report for This Property
The Home Valuation Report is an in-depth analysis detailing your home's value as well as a comparison with similar homes in the area
Home Values in the Area
Average Home Value in this Area
Purchase History
| Date | Buyer | Sale Price | Title Company |
|---|---|---|---|
| Lancaster Family Trust | -- | None Listed On Document | |
| Lancaster Charles W | -- | Southern Utah Title |
Source: Public Records
Mortgage History
| Date | Status | Borrower | Loan Amount |
|---|---|---|---|
| Previous Owner | Lancaster Charles W | $160,000 |
Source: Public Records
Tax History Compared to Growth
Tax History
| Year | Tax Paid | Tax Assessment Tax Assessment Total Assessment is a certain percentage of the fair market value that is determined by local assessors to be the total taxable value of land and additions on the property. | Land | Improvement |
|---|---|---|---|---|
| 2025 | $1,570 | $240,625 | $82,500 | $158,125 |
| 2023 | -- | $234,300 | $60,500 | $173,800 |
| 2022 | $2,041 | $230,065 | $60,500 | $169,565 |
| 2021 | $1,576 | $322,900 | $80,000 | $242,900 |
| 2020 | $0 | $282,600 | $75,000 | $207,600 |
| 2019 | $1,442 | $273,500 | $60,000 | $213,500 |
| 2018 | $1,409 | $137,555 | $0 | $0 |
| 2017 | $1,347 | $127,875 | $0 | $0 |
| 2016 | $1,382 | $121,165 | $0 | $0 |
| 2015 | -- | $117,315 | $0 | $0 |
| 2014 | $1,421 | $120,560 | $0 | $0 |
Source: Public Records
Map
Nearby Homes
- 262 W 200 S
- 148 S 200 W
- 257 S 230 W
- 336 W 270 S
- 704 W Desert Dove Ln
- 716 W Desert Dove Ln
- 692 W Desert Dove Ln
- 692 W Desert Dove Ln Unit (lot 3)
- 744 W Desert Dove Ln
- 744 W Desert Dove Ln Unit (lot 7)
- 140 W Center St Unit 20
- 492 S Memory Ln
- 88 N Apex Ln
- 97 S 495 W
- 543 W 80 S
- 249 S 100 W
- 576 W 30 S
- 480 W Tonapah Way
- 464 W Big Horn Way
- 582 W W 80 S