Estimated Value: $141,000 - $178,175
--
Bed
2
Baths
1,264
Sq Ft
$126/Sq Ft
Est. Value
About This Home
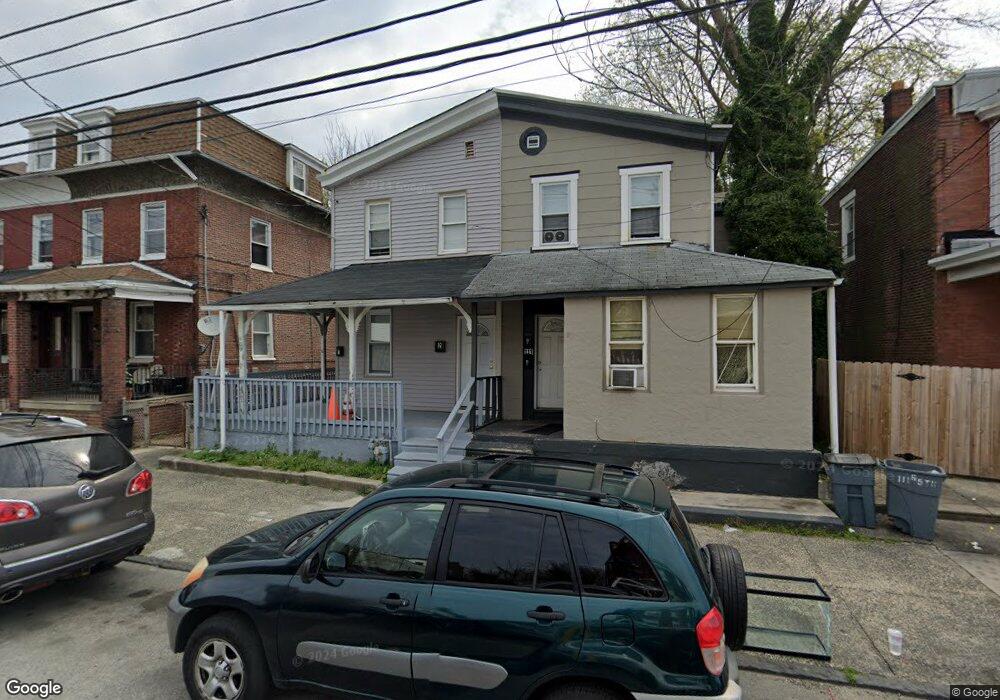
This home is located at 111 S 5th St, Darby, PA 19023 and is currently estimated at $159,544, approximately $126 per square foot. 111 S 5th St is a home located in Delaware County with nearby schools including Walnut Street Elementary School, Penn Wood Middle School, and Penn Wood High School - Cypress Street Campus.
Ownership History
Date
Name
Owned For
Owner Type
Purchase Details
Closed on
Jul 11, 2024
Sold by
Byrd Jason Donald and Smith Reesheba
Bought by
Delozier Stephen T
Current Estimated Value
Home Financials for this Owner
Home Financials are based on the most recent Mortgage that was taken out on this home.
Original Mortgage
$145,000
Interest Rate
6.99%
Mortgage Type
Construction
Purchase Details
Closed on
Feb 12, 2019
Sold by
Byrd Jada
Bought by
Byrd Jason
Purchase Details
Closed on
Dec 13, 2016
Sold by
Mosby Kevin M and Pnc Bank Na
Bought by
Byrd Jada
Purchase Details
Closed on
Apr 29, 2005
Sold by
Coles Juanita J
Bought by
Mosby Kevin
Home Financials for this Owner
Home Financials are based on the most recent Mortgage that was taken out on this home.
Original Mortgage
$54,300
Interest Rate
6.01%
Mortgage Type
Fannie Mae Freddie Mac
Create a Home Valuation Report for This Property
The Home Valuation Report is an in-depth analysis detailing your home's value as well as a comparison with similar homes in the area
Home Values in the Area
Average Home Value in this Area
Purchase History
| Date | Buyer | Sale Price | Title Company |
|---|---|---|---|
| Delozier Stephen T | $127,000 | None Listed On Document | |
| Byrd Jason | -- | None Available | |
| Byrd Jada | $8,100 | None Available | |
| Mosby Kevin | $57,165 | -- |
Source: Public Records
Mortgage History
| Date | Status | Borrower | Loan Amount |
|---|---|---|---|
| Closed | Delozier Stephen T | $145,000 | |
| Previous Owner | Mosby Kevin | $54,300 |
Source: Public Records
Tax History Compared to Growth
Tax History
| Year | Tax Paid | Tax Assessment Tax Assessment Total Assessment is a certain percentage of the fair market value that is determined by local assessors to be the total taxable value of land and additions on the property. | Land | Improvement |
|---|---|---|---|---|
| 2025 | $3,038 | $61,350 | $14,630 | $46,720 |
| 2024 | $3,038 | $61,350 | $14,630 | $46,720 |
| 2023 | $2,858 | $61,350 | $14,630 | $46,720 |
| 2022 | $2,780 | $61,350 | $14,630 | $46,720 |
| 2021 | $3,880 | $61,350 | $14,630 | $46,720 |
| 2020 | $3,283 | $44,940 | $13,870 | $31,070 |
| 2019 | $3,144 | $44,940 | $13,870 | $31,070 |
| 2018 | $3,105 | $44,940 | $0 | $0 |
| 2017 | $3,048 | $44,940 | $0 | $0 |
| 2016 | $252 | $44,940 | $0 | $0 |
| 2015 | $247 | $44,940 | $0 | $0 |
| 2014 | $247 | $44,940 | $0 | $0 |
Source: Public Records
Map
Nearby Homes