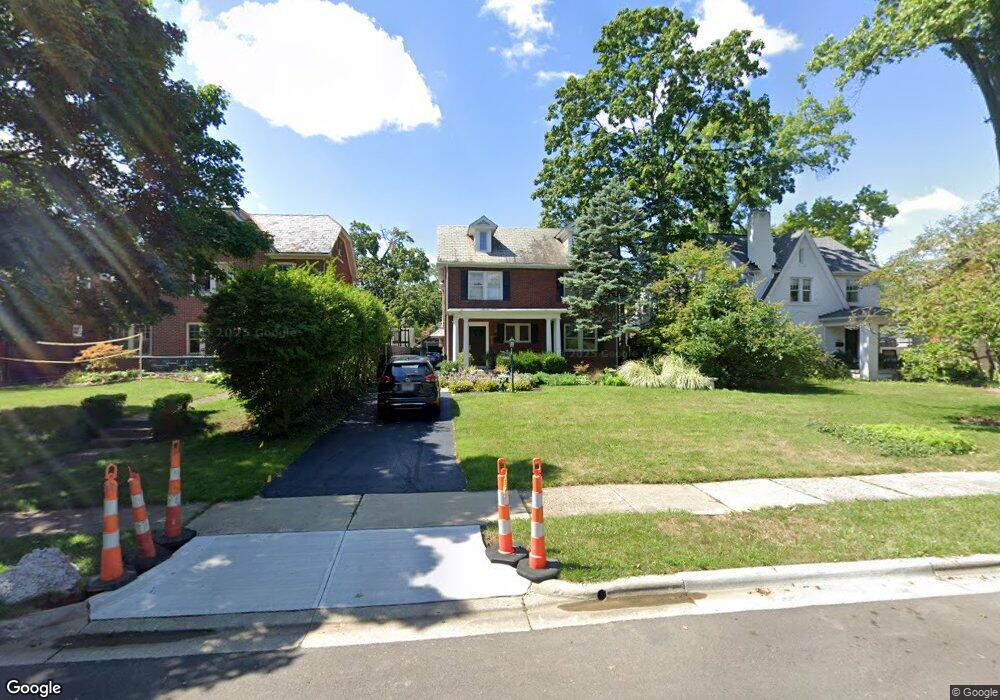
111 S Cassingham Rd Columbus, OH 43209
Estimated Value: $643,785 - $690,000
4
Beds
2
Baths
2,010
Sq Ft
$334/Sq Ft
Est. Value
About This Home
This home is located at 111 S Cassingham Rd, Columbus, OH 43209 and is currently estimated at $670,446, approximately $333 per square foot. 111 S Cassingham Rd is a home located in Franklin County with nearby schools including Cassingham Elementary School, Bexley Middle School, and Bexley High School.
Ownership History
Date
Name
Owned For
Owner Type
Purchase Details
Closed on
Aug 11, 1992
Bought by
Peters Frank D and Peters Cassie L
Current Estimated Value
Purchase Details
Closed on
Oct 1, 1985
Create a Home Valuation Report for This Property
The Home Valuation Report is an in-depth analysis detailing your home's value as well as a comparison with similar homes in the area
Home Values in the Area
Average Home Value in this Area
Purchase History
| Date | Buyer | Sale Price | Title Company |
|---|---|---|---|
| Peters Frank D | $167,000 | -- | |
| -- | $110,000 | -- |
Source: Public Records
Tax History
| Year | Tax Paid | Tax Assessment Tax Assessment Total Assessment is a certain percentage of the fair market value that is determined by local assessors to be the total taxable value of land and additions on the property. | Land | Improvement |
|---|---|---|---|---|
| 2025 | $10,504 | $189,150 | $70,320 | $118,830 |
| 2024 | $10,504 | $189,150 | $70,320 | $118,830 |
| 2023 | $9,444 | $189,150 | $70,320 | $118,830 |
| 2022 | $9,180 | $147,670 | $42,910 | $104,760 |
| 2021 | $9,188 | $147,670 | $42,910 | $104,760 |
| 2020 | $9,107 | $147,670 | $42,910 | $104,760 |
| 2019 | $8,604 | $122,750 | $35,770 | $86,980 |
| 2018 | $7,268 | $122,750 | $35,770 | $86,980 |
| 2017 | $7,296 | $122,750 | $35,770 | $86,980 |
| 2016 | $7,040 | $108,230 | $32,940 | $75,290 |
| 2015 | $7,061 | $108,230 | $32,940 | $75,290 |
| 2014 | $7,101 | $108,230 | $32,940 | $75,290 |
| 2013 | $3,354 | $98,350 | $29,925 | $68,425 |
Source: Public Records
Map
Nearby Homes
- 125 S Stanwood Rd
- 2465 E Broad St
- 2731 E Broad St
- 271 S Cassingham Rd
- 103 N Ardmore Rd
- 2417 Fair Ave
- 41 S Broadleigh Rd
- 50 S Chesterfield Rd
- 161 N Gould Rd
- 343 N Cassady Ave
- 57 Preston Rd
- 205 N Gould Rd
- 211 Preston Rd
- 2779 Columbus Ave
- 2793 Sherwood Rd
- 180 N Harding Rd
- 181 S Kellner Rd
- 3191 E Broad St
- 2822 Bellwood Ave
- 484 N Parkview Ave
- 103 S Cassingham Rd
- 115 S Cassingham Rd
- 123 S Cassingham Rd
- 93 S Cassingham Rd
- 129 S Cassingham Rd
- 104 S Ardmore Rd
- 110 S Ardmore Rd
- 96 S Ardmore Rd
- 89 S Cassingham Rd
- 116 S Ardmore Rd
- 88 S Ardmore Rd
- 137 S Cassingham Rd
- 81 S Cassingham Rd
- 122 S Ardmore Rd
- 114 S Cassingham Rd
- 82 S Ardmore Rd
- 108 S Cassingham Rd
- 120 S Cassingham Rd
- 120 S Cassingham Rd Unit BEXLEY
- 126 S Cassingham Rd
Your Personal Tour Guide
Ask me questions while you tour the home.