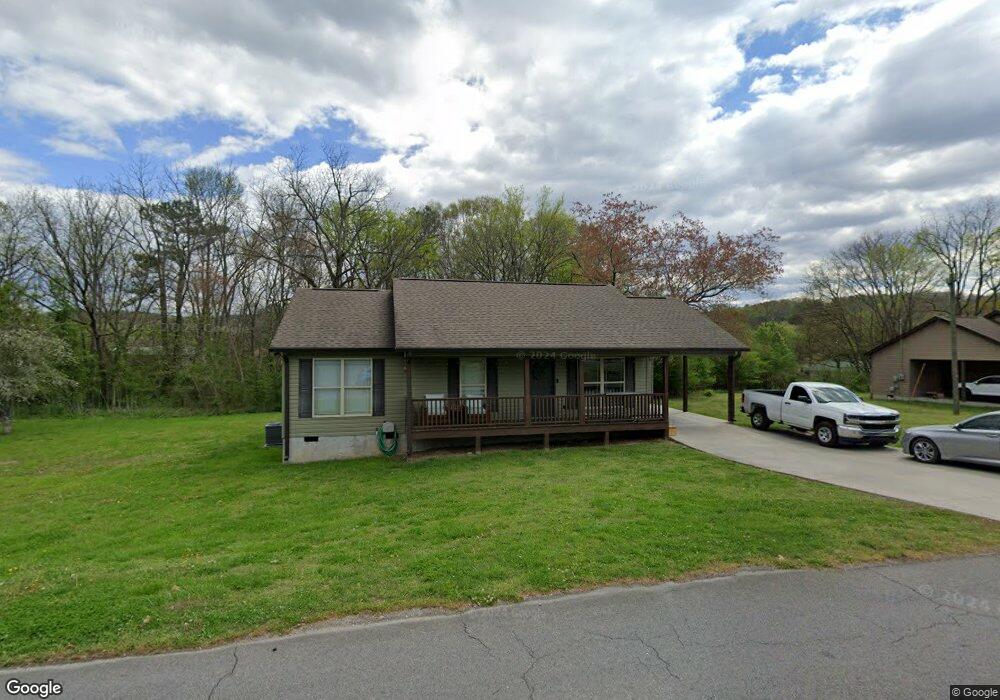
111 S Varnell Rd Tunnel Hill, GA 30755
Estimated Value: $210,989 - $248,000
--
Bed
--
Bath
1,244
Sq Ft
$190/Sq Ft
Est. Value
About This Home
This home is located at 111 S Varnell Rd, Tunnel Hill, GA 30755 and is currently estimated at $236,747, approximately $190 per square foot. 111 S Varnell Rd is a home with nearby schools including Tunnel Hill Elementary School, Westside Middle School, and Northwest Whitfield County High School.
Ownership History
Date
Name
Owned For
Owner Type
Purchase Details
Closed on
Apr 4, 2025
Sold by
Brandon Harrison & Company 115 Llc
Bought by
Mcphearson Nancy Tinsley and Mcphearson John L
Current Estimated Value
Purchase Details
Closed on
Feb 12, 2021
Sold by
Brandon Harrison & Company 308 Llc
Bought by
Holcomb Raymond
Purchase Details
Closed on
Jan 14, 2020
Sold by
Brandon Harrison & Co Llc
Bought by
Brandon Harrison & Co 111 Llc
Purchase Details
Closed on
Sep 3, 2015
Sold by
Miles Terry R
Bought by
Brandon Harrison & Co Llc
Home Financials for this Owner
Home Financials are based on the most recent Mortgage that was taken out on this home.
Original Mortgage
$18,400
Interest Rate
3.94%
Mortgage Type
New Conventional
Purchase Details
Closed on
Aug 24, 2007
Sold by
Rogers James D
Bought by
Rogers Oliver Harris
Purchase Details
Closed on
Dec 1, 1997
Bought by
Rogers James D
Create a Home Valuation Report for This Property
The Home Valuation Report is an in-depth analysis detailing your home's value as well as a comparison with similar homes in the area
Home Values in the Area
Average Home Value in this Area
Purchase History
| Date | Buyer | Sale Price | Title Company |
|---|---|---|---|
| Mcphearson Nancy Tinsley | $254,900 | None Listed On Document | |
| Mcphearson Nancy Tinsley | $254,900 | None Listed On Document | |
| Holcomb Raymond | -- | -- | |
| Brandon Harrison & Co 111 Llc | -- | -- | |
| Brandon Harrison & Co Llc | $23,000 | -- | |
| Rogers Oliver Harris | $20,000 | -- | |
| Rogers James D | -- | -- |
Source: Public Records
Mortgage History
| Date | Status | Borrower | Loan Amount |
|---|---|---|---|
| Previous Owner | Brandon Harrison & Co Llc | $18,400 |
Source: Public Records
Tax History Compared to Growth
Tax History
| Year | Tax Paid | Tax Assessment Tax Assessment Total Assessment is a certain percentage of the fair market value that is determined by local assessors to be the total taxable value of land and additions on the property. | Land | Improvement |
|---|---|---|---|---|
| 2024 | $1,662 | $81,857 | $4,483 | $77,374 |
| 2023 | $1,662 | $55,415 | $3,417 | $51,998 |
| 2022 | $1,141 | $38,674 | $3,000 | $35,674 |
| 2021 | $1,141 | $38,674 | $3,000 | $35,674 |
| 2020 | $1,180 | $38,674 | $3,000 | $35,674 |
| 2019 | $1,096 | $35,338 | $3,000 | $32,338 |
| 2018 | $1,098 | $34,864 | $2,526 | $32,338 |
| 2017 | $1,099 | $34,864 | $2,526 | $32,338 |
| 2016 | $77 | $31,938 | $2,526 | $29,412 |
| 2014 | $200 | $7,416 | $2,534 | $4,883 |
| 2013 | -- | $7,416 | $2,533 | $4,882 |
Source: Public Records
Map
Nearby Homes
- 203 S Cherry St
- 107 N Varnell Rd
- 3414 Chattanooga Rd
- 00 Old Chattanooga Rd
- 400 Crawford Terrace
- 0 Mount View Dr Unit 1517505
- 0 Mount View Dr Unit RTC2958565
- Lot 47 Robert Fuller Rd
- Lot 51 Robert Fuller Rd
- Lot 43 Robert Fuller Rd
- Lot 28 Robert Fuller Rd
- Lot 45 Robert Fuller Rd
- Lot 44 Robert Fuller Rd
- Lot 38 Keys Battery Ln
- Lot 42 Keys Battery Ln
- Lot 39 Keys Battery Ln
- Lot 30 Pat Cleburne Ln
- Lot 37 Pat Cleburne Ln
- 360 N Lakeshore Dr
- 0 Dockwell Unit 1517509
- 401 Regal Dr
- 104 S Varnell Rd
- 1804 S Varnell Rd
- 105 S Varnell Rd
- 107 S Varnell Rd
- 403 Regal Dr
- 104 Broad St
- 120 S Varnell Rd
- 102 S Varnell Rd
- 106 Broad St
- 102 Broad St
- 116 S Varnell Rd
- 108 Broad St
- 100 Broad St
- 205 S Cherry St
- 209 S Cherry St
- 100 S Varnell Rd
- 400 Regal Dr
- 126 S Varnell Rd
- 215 S Cherry St