Estimated Value: $221,000 - $260,000
3
Beds
2
Baths
1,428
Sq Ft
$171/Sq Ft
Est. Value
About This Home
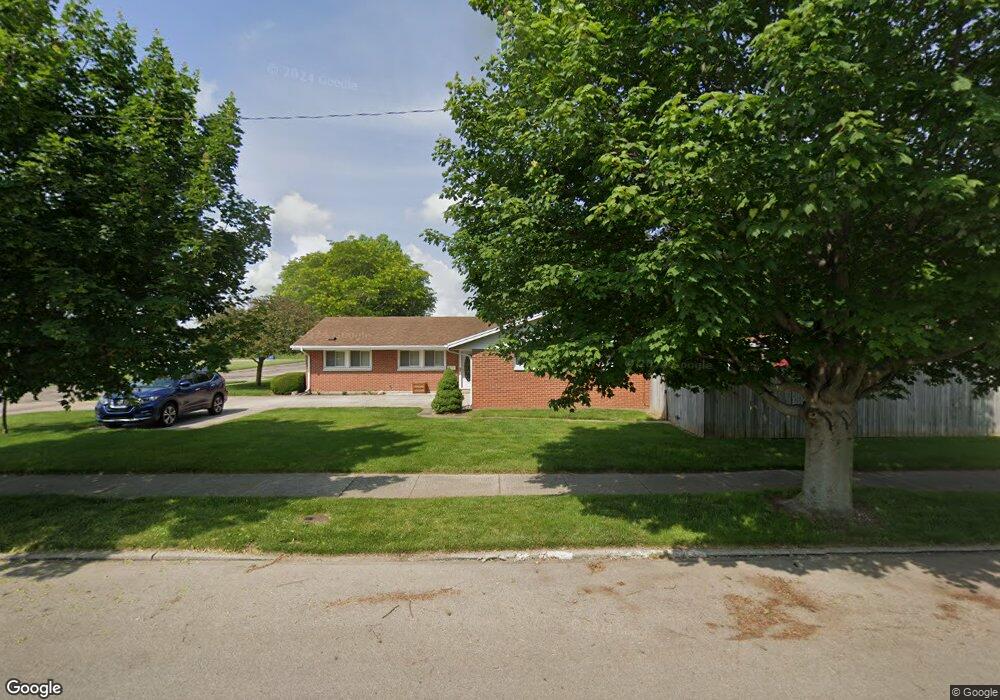
This home is located at 111 Shaftsbury Rd, Troy, OH 45373 and is currently estimated at $243,596, approximately $170 per square foot. 111 Shaftsbury Rd is a home located in Miami County with nearby schools including Cookson Elementary School, Troy Junior High School, and Van Cleve Elementary School.
Ownership History
Date
Name
Owned For
Owner Type
Purchase Details
Closed on
Apr 15, 2024
Sold by
Bretland Janet L and Snyder Charlotte G
Bought by
Osborne Kaylie R and Osborne William T
Current Estimated Value
Home Financials for this Owner
Home Financials are based on the most recent Mortgage that was taken out on this home.
Original Mortgage
$207,668
Outstanding Balance
$204,600
Interest Rate
6.94%
Mortgage Type
FHA
Estimated Equity
$38,996
Purchase Details
Closed on
Jun 28, 2017
Sold by
Lewis George E
Bought by
Nancy C Lewis
Home Financials for this Owner
Home Financials are based on the most recent Mortgage that was taken out on this home.
Interest Rate
3.9%
Purchase Details
Closed on
May 15, 2002
Sold by
Kadel Anna Mae
Bought by
Lewis George E and Lewis Nancy C
Purchase Details
Closed on
Jun 14, 1991
Bought by
Kadel Anna Mae
Create a Home Valuation Report for This Property
The Home Valuation Report is an in-depth analysis detailing your home's value as well as a comparison with similar homes in the area
Home Values in the Area
Average Home Value in this Area
Purchase History
| Date | Buyer | Sale Price | Title Company |
|---|---|---|---|
| Osborne Kaylie R | $211,500 | None Listed On Document | |
| Nancy C Lewis | -- | -- | |
| Lewis George E | $105,000 | -- | |
| Kadel Anna Mae | -- | -- |
Source: Public Records
Mortgage History
| Date | Status | Borrower | Loan Amount |
|---|---|---|---|
| Open | Osborne Kaylie R | $207,668 | |
| Previous Owner | Lewis George E | -- |
Source: Public Records
Tax History Compared to Growth
Tax History
| Year | Tax Paid | Tax Assessment Tax Assessment Total Assessment is a certain percentage of the fair market value that is determined by local assessors to be the total taxable value of land and additions on the property. | Land | Improvement |
|---|---|---|---|---|
| 2024 | $1,843 | $58,700 | $12,250 | $46,450 |
| 2023 | $1,843 | $58,700 | $12,250 | $46,450 |
| 2022 | $1,568 | $58,700 | $12,250 | $46,450 |
| 2021 | $1,148 | $43,480 | $9,070 | $34,410 |
| 2020 | $1,150 | $43,480 | $9,070 | $34,410 |
| 2019 | $1,160 | $43,480 | $9,070 | $34,410 |
| 2018 | $1,162 | $42,250 | $10,150 | $32,100 |
| 2017 | $1,174 | $42,250 | $10,150 | $32,100 |
| 2016 | $1,157 | $42,250 | $10,150 | $32,100 |
| 2015 | $1,045 | $37,740 | $9,070 | $28,670 |
| 2014 | $1,045 | $37,740 | $9,070 | $28,670 |
| 2013 | $1,051 | $37,740 | $9,070 | $28,670 |
Source: Public Records
Map
Nearby Homes
- 123 Shaftsbury Rd
- 135 Shaftsbury Rd
- 135 Robin Hood Ln
- 163 Shaftsbury Rd
- 166 Dronfield Rd
- 190 Robin Hood Ln
- 93 Robin Hood Ln
- 189 Shaftsbury Rd
- 158 Dronfield Rd
- 210 Robin Hood Ln
- 209 Shaftsbury Rd
- 193 Dronfield Rd
- 142 Dronfield Rd
- 150 Shaftsbury Rd
- 81 Robin Hood Ln
- 162 Shaftsbury Rd
- 167 Dronfield Rd
- 242 Robin Hood Ln
- 188 Shaftsbury Rd
- 86 Denby Place