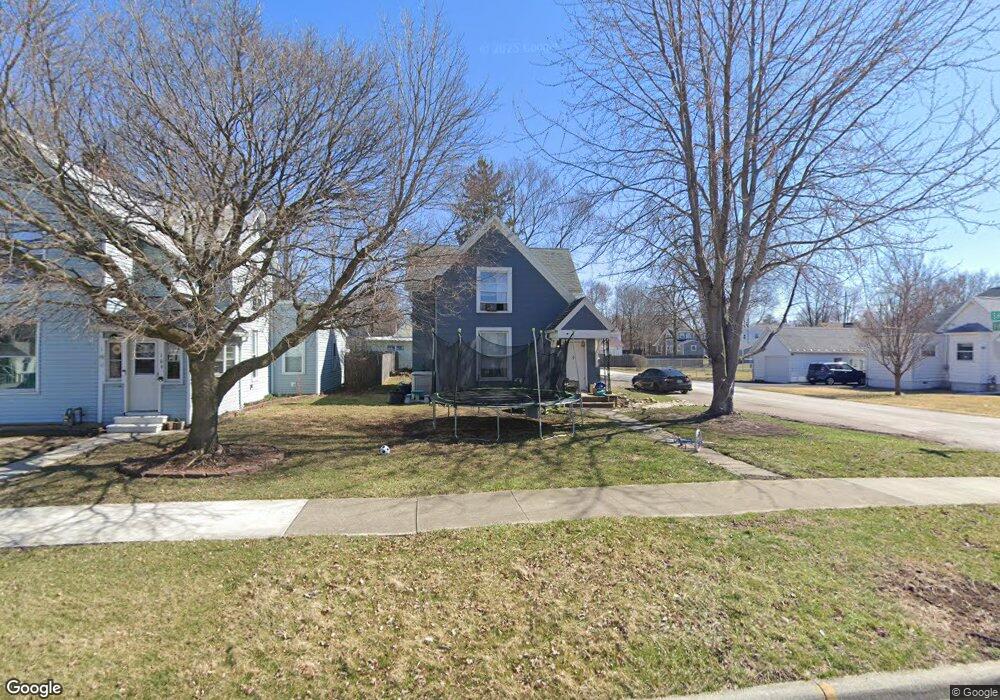
111 Shinkle St Findlay, OH 45840
Estimated Value: $143,828 - $170,000
3
Beds
2
Baths
1,621
Sq Ft
$96/Sq Ft
Est. Value
About This Home
This home is located at 111 Shinkle St, Findlay, OH 45840 and is currently estimated at $155,457, approximately $95 per square foot. 111 Shinkle St is a home located in Hancock County with nearby schools including Lincoln Elementary School, Donnell Middle School, and Findlay High School.
Ownership History
Date
Name
Owned For
Owner Type
Purchase Details
Closed on
Jun 4, 1998
Sold by
Slough James
Bought by
Michel Francis and Michel Dreema
Current Estimated Value
Home Financials for this Owner
Home Financials are based on the most recent Mortgage that was taken out on this home.
Original Mortgage
$55,930
Outstanding Balance
$11,090
Interest Rate
7.27%
Mortgage Type
FHA
Estimated Equity
$144,367
Purchase Details
Closed on
Apr 29, 1988
Bought by
Slough Properties Inc
Purchase Details
Closed on
Dec 1, 1987
Bought by
Slough Slough R and Slough Margaret
Create a Home Valuation Report for This Property
The Home Valuation Report is an in-depth analysis detailing your home's value as well as a comparison with similar homes in the area
Home Values in the Area
Average Home Value in this Area
Purchase History
| Date | Buyer | Sale Price | Title Company |
|---|---|---|---|
| Michel Francis | $56,000 | -- | |
| Slough Properties Inc | $20,000 | -- | |
| Slough Slough R | -- | -- |
Source: Public Records
Mortgage History
| Date | Status | Borrower | Loan Amount |
|---|---|---|---|
| Open | Michel Francis | $55,930 |
Source: Public Records
Tax History
| Year | Tax Paid | Tax Assessment Tax Assessment Total Assessment is a certain percentage of the fair market value that is determined by local assessors to be the total taxable value of land and additions on the property. | Land | Improvement |
|---|---|---|---|---|
| 2024 | $1,286 | $35,280 | $3,810 | $31,470 |
| 2023 | $1,288 | $35,280 | $3,810 | $31,470 |
| 2022 | $1,284 | $35,280 | $3,810 | $31,470 |
| 2021 | $1,215 | $29,090 | $3,810 | $25,280 |
| 2020 | $1,215 | $29,090 | $3,810 | $25,280 |
| 2019 | $1,191 | $29,090 | $3,810 | $25,280 |
| 2018 | $1,066 | $23,880 | $3,120 | $20,760 |
| 2017 | $1,066 | $23,880 | $3,120 | $20,760 |
| 2016 | $1,062 | $23,880 | $3,120 | $20,760 |
| 2015 | $673 | $14,970 | $2,090 | $12,880 |
| 2014 | $673 | $14,970 | $2,090 | $12,880 |
| 2012 | $607 | $13,380 | $2,090 | $11,290 |
Source: Public Records
Map
Nearby Homes
Your Personal Tour Guide
Ask me questions while you tour the home.