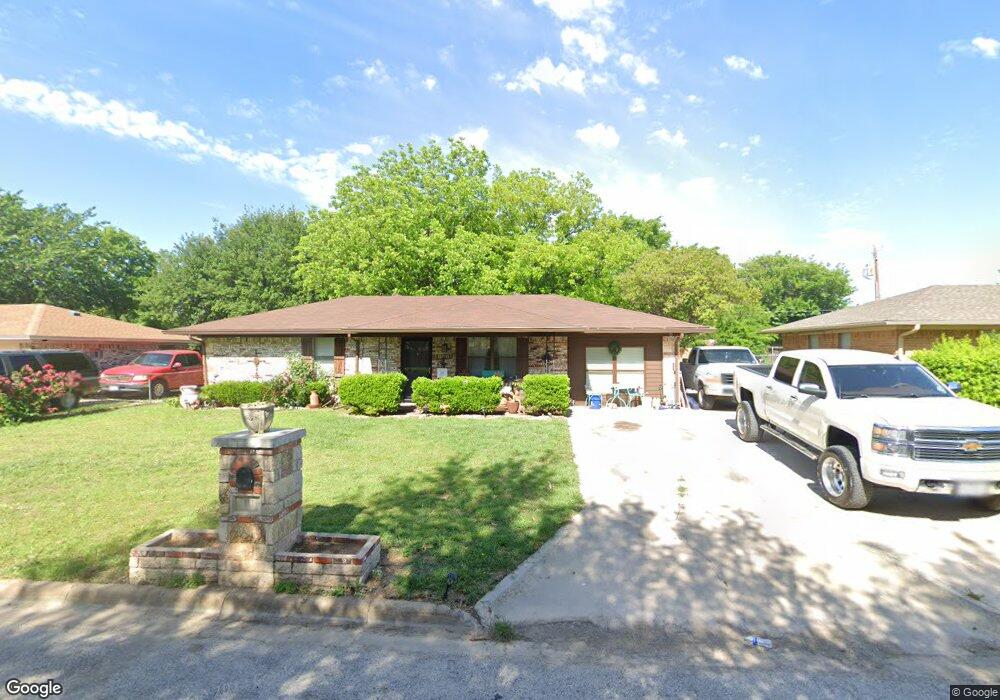
111 Southside Dr Sanger, TX 76266
Estimated Value: $199,000 - $265,000
3
Beds
1
Bath
912
Sq Ft
$239/Sq Ft
Est. Value
About This Home
This home is located at 111 Southside Dr, Sanger, TX 76266 and is currently estimated at $218,048, approximately $239 per square foot. 111 Southside Dr is a home located in Denton County with nearby schools including Chisholm Trail Elementary School, Clear Creek Intermediate School, and Sanger Sixth Grade Campus.
Create a Home Valuation Report for This Property
The Home Valuation Report is an in-depth analysis detailing your home's value as well as a comparison with similar homes in the area
Home Values in the Area
Average Home Value in this Area
Tax History Compared to Growth
Tax History
| Year | Tax Paid | Tax Assessment Tax Assessment Total Assessment is a certain percentage of the fair market value that is determined by local assessors to be the total taxable value of land and additions on the property. | Land | Improvement |
|---|---|---|---|---|
| 2025 | $1,982 | $156,084 | $68,188 | $87,896 |
| 2024 | $3,135 | $155,132 | $0 | $0 |
| 2023 | $1,701 | $141,029 | $51,141 | $109,923 |
| 2022 | $2,843 | $128,208 | $51,141 | $94,081 |
| 2021 | $2,497 | $118,821 | $32,815 | $86,006 |
| 2020 | $2,345 | $105,957 | $32,815 | $73,142 |
| 2019 | $2,391 | $105,004 | $32,815 | $72,189 |
| 2018 | $1,808 | $78,988 | $23,440 | $55,548 |
| 2017 | $2,088 | $90,784 | $23,440 | $67,344 |
| 2016 | $2,078 | $79,174 | $13,638 | $65,536 |
| 2015 | $1,344 | $67,486 | $13,638 | $53,848 |
| 2013 | -- | $55,793 | $17,938 | $37,855 |
Source: Public Records
Map
Nearby Homes
- 202 Southland Dr
- 130 Southside Dr
- 209 Southland Dr
- 321 Quail Crossing Dr
- 319 Quail Crossing Dr
- 226 Hillcrest St
- 2000 S Stemmons St
- 2004 S Stemmons St
- 212 Diane Dr
- 124 Morning Glory
- 113 Diane Dr
- 114 Pintail Ln
- 117 Teal Rd
- 109 Colonial Heights
- 108 Magnolia Dr
- 185 Aster Dr
- 942 First St
- 936 First St
- 505 Houston St
- 141 Shady Grove Dr
- 109 Southside Dr
- 113 Southside Dr
- 112 Southmeadow Dr
- 110 Southmeadow Dr
- 107 Southside Dr
- 115 Southside Dr
- 114 Southmeadow Dr
- 108 Southmeadow Dr
- 112 Southside Dr
- 114 Southside Dr
- 110 Southside Dr
- 105 Southside Dr
- 117 Southside Dr
- 116 Southmeadow Dr
- 116 Southside Dr
- 106 Southmeadow Dr
- 108 Southside Dr
- 118 Southside Dr
- 118 Southmeadow Dr
- 119 Southside Dr