Estimated Value: $276,592 - $309,000
3
Beds
2
Baths
1,393
Sq Ft
$212/Sq Ft
Est. Value
About This Home
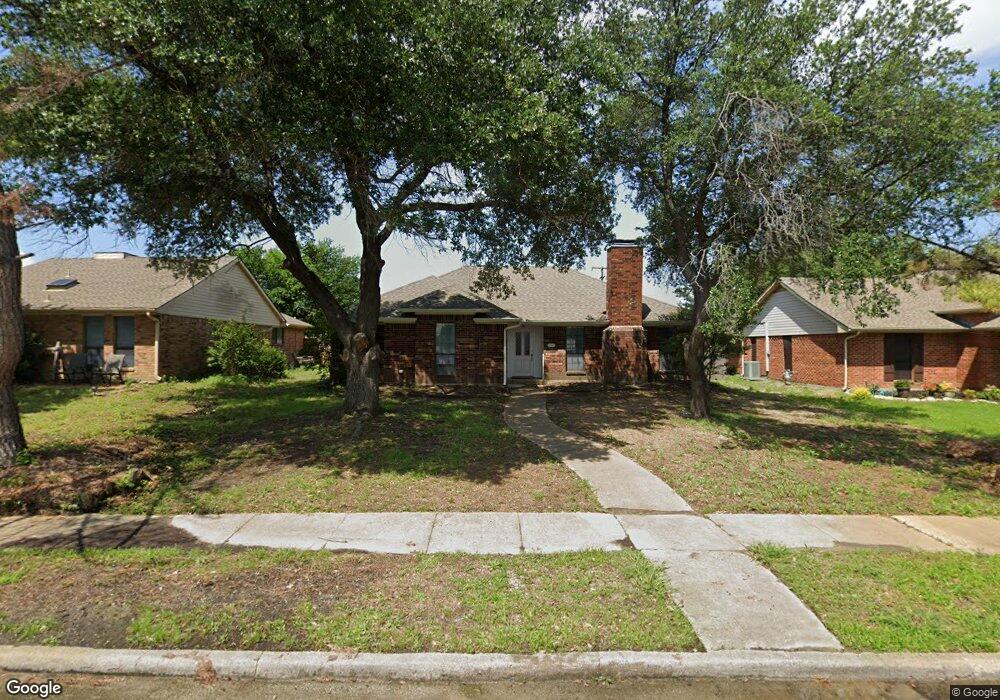
This home is located at 111 Spence Dr, Wylie, TX 75098 and is currently estimated at $295,148, approximately $211 per square foot. 111 Spence Dr is a home located in Collin County with nearby schools including P M Akin Elementary School, AB Harrison Intermediate School, and Grady Burnett J High School.
Ownership History
Date
Name
Owned For
Owner Type
Purchase Details
Closed on
Feb 22, 2023
Sold by
Mulliqi Genc
Bought by
Mulliqi Investments Llc
Current Estimated Value
Purchase Details
Closed on
Jan 12, 2021
Sold by
Mulliqi Investments Llc
Bought by
Mulliqi Genc
Purchase Details
Closed on
Dec 27, 2019
Sold by
Land Tex Inc
Bought by
Mulliqi Investments Llc
Purchase Details
Closed on
Jun 29, 2011
Sold by
Ross Daniel S
Bought by
Land Tex Inc
Home Financials for this Owner
Home Financials are based on the most recent Mortgage that was taken out on this home.
Original Mortgage
$75,000
Interest Rate
4.66%
Mortgage Type
Purchase Money Mortgage
Purchase Details
Closed on
Oct 1, 1999
Sold by
Land Tex Inc
Bought by
Ross Daniel S
Home Financials for this Owner
Home Financials are based on the most recent Mortgage that was taken out on this home.
Original Mortgage
$180,000
Interest Rate
7.83%
Mortgage Type
Seller Take Back
Create a Home Valuation Report for This Property
The Home Valuation Report is an in-depth analysis detailing your home's value as well as a comparison with similar homes in the area
Home Values in the Area
Average Home Value in this Area
Purchase History
| Date | Buyer | Sale Price | Title Company |
|---|---|---|---|
| Mulliqi Investments Llc | -- | Simplifile | |
| Mulliqi Genc | -- | None Available | |
| Mulliqi Investments Llc | -- | None Available | |
| Land Tex Inc | -- | Ltic | |
| Ross Daniel S | -- | -- |
Source: Public Records
Mortgage History
| Date | Status | Borrower | Loan Amount |
|---|---|---|---|
| Previous Owner | Land Tex Inc | $75,000 | |
| Previous Owner | Ross Daniel S | $180,000 |
Source: Public Records
Tax History Compared to Growth
Tax History
| Year | Tax Paid | Tax Assessment Tax Assessment Total Assessment is a certain percentage of the fair market value that is determined by local assessors to be the total taxable value of land and additions on the property. | Land | Improvement |
|---|---|---|---|---|
| 2025 | $4,954 | $246,319 | $80,750 | $165,569 |
| 2024 | $4,954 | $250,808 | $80,750 | $170,058 |
| 2023 | $4,954 | $232,000 | $76,000 | $156,000 |
| 2022 | $5,251 | $239,331 | $61,750 | $177,581 |
| 2021 | $4,903 | $208,376 | $61,750 | $146,626 |
| 2020 | $3,725 | $150,000 | $47,500 | $102,500 |
| 2019 | $4,773 | $181,632 | $47,500 | $134,132 |
| 2018 | $4,470 | $166,000 | $47,500 | $118,500 |
| 2017 | $3,709 | $137,715 | $28,500 | $109,215 |
| 2016 | $3,492 | $125,689 | $28,500 | $97,189 |
| 2015 | $3,157 | $111,964 | $28,500 | $83,464 |
Source: Public Records
Map
Nearby Homes
- 207 Spence Dr
- 114 Liberty Dr
- 104 N 5th St
- 104 Rushcreek Dr
- 300 Woodhollow Ct
- 306 Woodhollow Ct
- 304 Hawthorn Dr
- 1022 Debby Ct
- 310 Hawthorn Dr
- 216 Cedar Ridge St
- 303 N 2nd St
- 301 S 3rd St
- 825 Foxwood Ln
- 820 Foxwood Ln
- 409 Cedar Ridge Dr
- 811 Forest Edge Ln
- 416 Dogwood Dr
- 327 S 4th St
- 825 Forest Edge Ln
- 329 S 2nd St