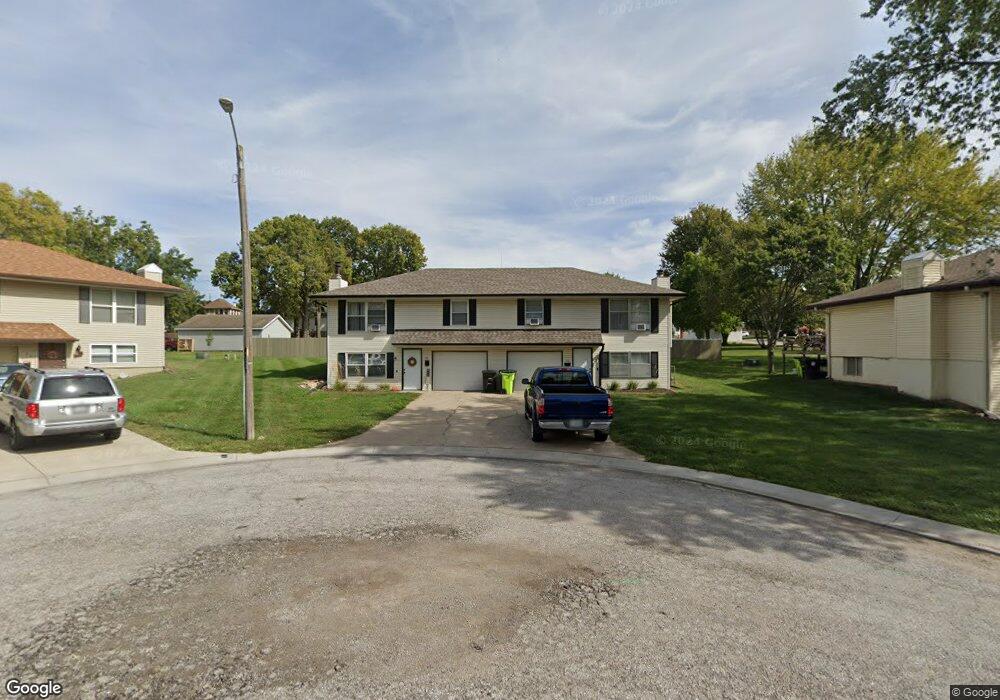
111 Spring Ct Belton, MO 64012
Estimated Value: $255,000 - $322,000
4
Beds
2
Baths
1,680
Sq Ft
$175/Sq Ft
Est. Value
About This Home
This home is located at 111 Spring Ct, Belton, MO 64012 and is currently estimated at $294,011, approximately $175 per square foot. 111 Spring Ct is a home located in Cass County with nearby schools including Scott Elementary School, Mill Creek Upper Elementary School, and Belton Middle School.
Ownership History
Date
Name
Owned For
Owner Type
Purchase Details
Closed on
Nov 19, 2025
Sold by
Niswonger Rachel E and Stark Charles R
Bought by
Margita Daniel J
Current Estimated Value
Home Financials for this Owner
Home Financials are based on the most recent Mortgage that was taken out on this home.
Original Mortgage
$223,500
Outstanding Balance
$223,500
Interest Rate
6.3%
Mortgage Type
New Conventional
Estimated Equity
$70,511
Purchase Details
Closed on
Nov 4, 2021
Sold by
Hutsell Suzanne
Bought by
Hutsell Curtiss
Home Financials for this Owner
Home Financials are based on the most recent Mortgage that was taken out on this home.
Original Mortgage
$250,871
Interest Rate
2.88%
Mortgage Type
FHA
Purchase Details
Closed on
Nov 3, 2021
Sold by
Hutsell Curtiss
Bought by
Niswonger Rachel E and Stark Charles R
Home Financials for this Owner
Home Financials are based on the most recent Mortgage that was taken out on this home.
Original Mortgage
$250,871
Interest Rate
2.88%
Mortgage Type
FHA
Purchase Details
Closed on
May 26, 2006
Sold by
Huwar Susan K and Huwar Timothy J
Bought by
Hutsell Curtiss
Home Financials for this Owner
Home Financials are based on the most recent Mortgage that was taken out on this home.
Original Mortgage
$110,250
Interest Rate
6.5%
Mortgage Type
New Conventional
Create a Home Valuation Report for This Property
The Home Valuation Report is an in-depth analysis detailing your home's value as well as a comparison with similar homes in the area
Home Values in the Area
Average Home Value in this Area
Purchase History
| Date | Buyer | Sale Price | Title Company |
|---|---|---|---|
| Margita Daniel J | -- | Alliance Nationwide Title Agen | |
| Hutsell Curtiss | -- | None Available | |
| Niswonger Rachel E | -- | Coffelt Land Title Inc | |
| Hutsell Curtiss | -- | -- |
Source: Public Records
Mortgage History
| Date | Status | Borrower | Loan Amount |
|---|---|---|---|
| Open | Margita Daniel J | $223,500 | |
| Previous Owner | Niswonger Rachel E | $250,871 | |
| Previous Owner | Hutsell Curtiss | $110,250 |
Source: Public Records
Tax History
| Year | Tax Paid | Tax Assessment Tax Assessment Total Assessment is a certain percentage of the fair market value that is determined by local assessors to be the total taxable value of land and additions on the property. | Land | Improvement |
|---|---|---|---|---|
| 2025 | $2,614 | $35,560 | $2,740 | $32,820 |
| 2024 | $2,614 | $31,710 | $2,490 | $29,220 |
| 2023 | $2,608 | $31,710 | $2,490 | $29,220 |
| 2022 | $2,285 | $27,540 | $2,490 | $25,050 |
| 2021 | $2,285 | $27,540 | $2,490 | $25,050 |
| 2020 | $2,225 | $26,660 | $2,490 | $24,170 |
| 2019 | $2,179 | $26,660 | $2,490 | $24,170 |
| 2018 | $1,915 | $23,630 | $1,990 | $21,640 |
| 2017 | $1,761 | $23,630 | $1,990 | $21,640 |
| 2016 | $1,761 | $21,610 | $1,990 | $19,620 |
| 2015 | $1,761 | $21,610 | $1,990 | $19,620 |
| 2014 | $1,767 | $21,610 | $1,990 | $19,620 |
| 2013 | -- | $21,610 | $1,990 | $19,620 |
Source: Public Records
Map
Nearby Homes
- 107 Spring Ct Unit 109
- 115 Spring Ct Unit 117
- 113 Spring Ct
- 108 Spring Ct Unit 110
- 110 S Scott Ave
- 112 Spring Ct Unit 114
- 116 Spring Ct
- 108 S Scott Ave
- 112 S Scott Ave
- 107 Spring St Unit B
- 107 Spring St
- 107 Spring St
- 107 Spring St
- 118 Spring St
- 109 Spring St
- 109 Spring St
- 114 S Scott Ave
- 105 Spring St
- 111 Spring St
- 103 Spring St
Your Personal Tour Guide
Ask me questions while you tour the home.