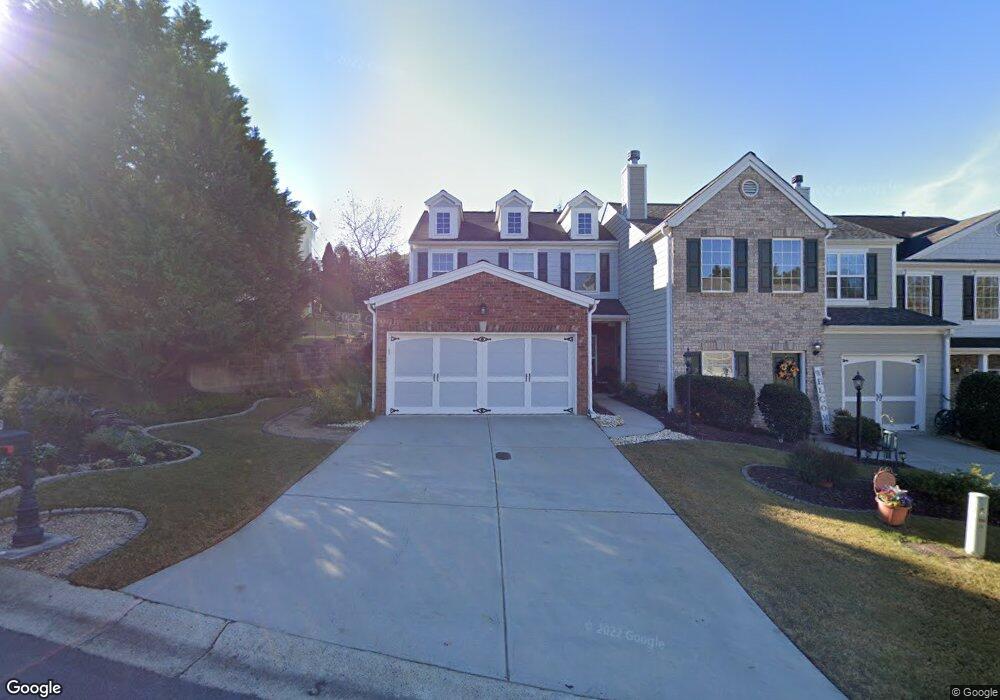
111 Spring Way Square Canton, GA 30114
Estimated Value: $299,686 - $313,000
3
Beds
3
Baths
1,580
Sq Ft
$194/Sq Ft
Est. Value
About This Home
This home is located at 111 Spring Way Square, Canton, GA 30114 and is currently estimated at $306,343, approximately $193 per square foot. 111 Spring Way Square is a home located in Cherokee County with nearby schools including Liberty Elementary School, Freedom Middle School, and Cherokee High School.
Ownership History
Date
Name
Owned For
Owner Type
Purchase Details
Closed on
Mar 25, 2010
Sold by
Bodahl Gerry R
Bought by
Allen Angela A
Current Estimated Value
Home Financials for this Owner
Home Financials are based on the most recent Mortgage that was taken out on this home.
Original Mortgage
$106,043
Outstanding Balance
$69,619
Interest Rate
4.87%
Mortgage Type
FHA
Estimated Equity
$236,724
Purchase Details
Closed on
Oct 15, 2004
Sold by
Homeland Legacy Inc
Bought by
Bodahl Gerry R
Home Financials for this Owner
Home Financials are based on the most recent Mortgage that was taken out on this home.
Original Mortgage
$116,720
Interest Rate
4.12%
Purchase Details
Closed on
Jul 7, 2004
Sold by
Brooks Land Inc
Bought by
Homeland Legacy Inc
Home Financials for this Owner
Home Financials are based on the most recent Mortgage that was taken out on this home.
Original Mortgage
$545,300
Interest Rate
5.91%
Create a Home Valuation Report for This Property
The Home Valuation Report is an in-depth analysis detailing your home's value as well as a comparison with similar homes in the area
Home Values in the Area
Average Home Value in this Area
Purchase History
| Date | Buyer | Sale Price | Title Company |
|---|---|---|---|
| Allen Angela A | $108,000 | -- | |
| Bodahl Gerry R | $145,900 | -- | |
| Homeland Legacy Inc | $17,800 | -- |
Source: Public Records
Mortgage History
| Date | Status | Borrower | Loan Amount |
|---|---|---|---|
| Open | Allen Angela A | $106,043 | |
| Previous Owner | Bodahl Gerry R | $116,720 | |
| Previous Owner | Homeland Legacy Inc | $545,300 |
Source: Public Records
Tax History
| Year | Tax Paid | Tax Assessment Tax Assessment Total Assessment is a certain percentage of the fair market value that is determined by local assessors to be the total taxable value of land and additions on the property. | Land | Improvement |
|---|---|---|---|---|
| 2025 | $2,647 | $113,952 | $26,000 | $87,952 |
| 2024 | $2,513 | $105,344 | $24,000 | $81,344 |
| 2023 | $2,552 | $105,840 | $24,000 | $81,840 |
| 2022 | $2,255 | $89,640 | $20,000 | $69,640 |
| 2021 | $1,533 | $69,640 | $17,200 | $52,440 |
| 2020 | $1,942 | $67,600 | $15,200 | $52,400 |
| 2019 | $1,324 | $59,040 | $13,600 | $45,440 |
| 2018 | $1,663 | $53,880 | $12,000 | $41,880 |
| 2017 | $1,509 | $122,500 | $10,400 | $38,600 |
| 2016 | $1,124 | $119,900 | $10,400 | $37,560 |
| 2015 | $1,021 | $105,900 | $9,200 | $33,160 |
| 2014 | $972 | $99,900 | $9,200 | $30,760 |
Source: Public Records
Map
Nearby Homes
- 112 Spring Way Square
- 116 Spring Way Square
- 230 Valley Crossing
- 342 Hidden Creek Ln
- 288 Valley Crossing
- 107 Hidden Lake Cir
- 922 Gardenia Curve
- 116 Hidden Lake Cir
- 808 Inkberry Rd
- 150 Hidden Lake Cir
- 114 Oleander Way
- 729 Mountain Laurel Dr
- 107 Nacoochee Way
- 151 Ilex Dr
- 188 Ilex Dr
- 190 Ilex Dr
- 134 Childers Rd
- 291 Springs Crossing
- 255 Osmanthus Way
- 107 Cypress Ct
- 113 Spring Way Square Unit 76
- 115 Spring Way Square
- 109 Spring Way Square
- 117 Spring Way Square
- 107 Spring Way Square
- 208 Valley Crossing Unit 87
- 119 Spring Way Square
- 210 Valley Crossing Unit 88
- 105 Spring Way Square
- 206 Valley Crossing Unit 86
- 212 Valley Crossing
- 212 Valley Crossing Unit 212
- 114 Spring Way Square
- 103 Spring Way Square
- 204 Valley Crossing Unit 85
- 204 Valley Crossing
- 214 Valley Crossing
- 118 Spring Way Square
- 118 Spring Way Square Unit 6
- 110 Spring Way Square
Your Personal Tour Guide
Ask me questions while you tour the home.